. 2024 Dec 21;15(12):1648.
doi: 10.3390/genes15121648.

The Arabidopsis thaliana Double-Stranded RNA Binding Proteins DRB1 and DRB2 Are Required for miR160-Mediated Responses to Exogenous Auxin

Affiliations

The Arabidopsis thaliana Double-Stranded RNA Binding Proteins DRB1 and DRB2 Are Required for miR160-Mediated Responses to Exogenous Auxin

Kim Zimmerman et al. Genes (Basel). .

Abstract

DOUBLE-STRANDED RNA BINDING (DRB) proteins DRB1, DRB2, and DRB4 are essential for microRNA (miRNA) production in Arabidopsis thaliana (Arabidopsis) with miR160, and its target genes, AUXIN RESPONSE FACTOR10 (ARF10), ARF16, and ARF17, forming an auxin responsive miRNA expression module crucial for root development. Methods: Wild-type Arabidopsis plants (Columbia-0 (Col-0)) and the drb1, drb2, and drb12 mutants were treated with the synthetic auxin 2,4-dichlorophenoxyacetic acid (2,4-D), and the miR160-mediated response of these four Arabidopsis lines was phenotypically and molecularly characterized. Results: In 2,4-D-treated Col-0, drb1 and drb2 plants, altered miR160 abundance and ARF10, ARF16, and ARF17 gene expression were associated with altered root system development. However, miR160-directed molecular responses to treatment with 2,4-D was largely defective in the drb12 double mutant. In addition, via profiling of molecular components of the miR160 expression module in the roots of the drb4, drb14, and drb24 mutants, we uncovered a previously unknown role for DRB4 in regulating miR160 production. Conclusions: The miR160 expression module forms a central component of the molecular and phenotypic response of Arabidopsis plants to exogenous auxin treatment. Furthermore, DRB1, DRB2, and DRB4 are all required in Arabidopsis roots to control miR160 production, and subsequently, to appropriately regulate ARF10, ARF16, and ARF17 target gene expression.

Keywords: ARF16; ARF17; AUXIN RESPONSE FACTOR10 (ARF10); Arabidopsis thaliana (Arabidopsis); miR160 expression module; microRNA160 (miR160); root development; synthetic auxin.


Conflict of interest statement

The authors declare no conflicts of interest.

Figures
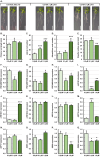
Figure 1
Figure 1
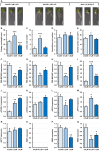
Phenotypic and molecular analysis of Col-0 plants treated with 2,4-D. (A) Representative phenotypes displayed by three individual 21-day-old untreated Col-0 plants or following the treatment of Col-0 plants with 0.1 μM and 1.0 μM 2,4-D. Scale bar = 1.0 cm. (BE) Quantification of primary root length (B), lateral root number (C), adventitious root number (D), and rosette leaf surface area (E) of 21-day-old untreated Col-0 plants or following the treatment of Col-0 plants with 0.1 μM and 1.0 μM 2,4-D. (FQ) Molecular analysis of all components of the miR160 expression module in the roots of 21-day-old untreated Col-0 plants or following the treatment of Col-0 plants with 0.1 μM and 1.0 μM 2,4-D, including profiling the expression of PRE-MIR160A (F), PRE-MIR160B (G), PRE-MIR160C (H), miR160 (I), eTM160-1 (J), eTM160-2 (K), ARF10 (L), ARF16 (M), ARF17 (N), DRB1 (O), DRB2 (P), and DRB4 (Q). (BQ) All phenotypic and molecular analyses relied on the use of three biological replicates and each replicate consisted of a pool of six plants. Altered development (BE) or changed transcript abundance (FQ) was determined via comparison of the Col-0/0.1 μM and Col-0/1.0 μM treated samples to the values obtained for the untreated Col-0/0.0 μM sample by a standard two-tailed t-test. Error bars represent the standard error of the mean (SEM) and an asterisk (*) shows * p ≤ 0.05, ** p ≤ 0.01, *** p ≤ 0.001.
Figure 2
Figure 2
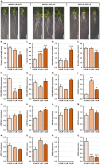
Phenotypic and molecular analysis of 21-day-old drb1 plants treated with 2,4-D. (A) Representative phenotypes displayed by three individual 21-day-old untreated drb1 control plants or following treatment of drb1 plants with 0.1 μM and 1.0 μM 2,4-D. Scale bar = 1.0 cm. (BE) Quantification of primary root length (B), lateral root number (C), adventitious root number (D), and rosette leaf surface area (E) of 21-day-old untreated drb1 control plants or following the treatment of drb1 plants with 0.1 μM and 1.0 μM 2,4-D. (FQ) Molecular analysis of all components of the miR160 expression module in the roots of 21-day-old untreated drb1 plants or following treatment of drb1 plants with 0.1 μM and 1.0 μM 2,4-D, including profiling of the expression of PRE-MIR160A (F), PRE-MIR160B (G), PRE-MIR160C (H), miR160 (I), eTM160-1 (J), eTM160-2 (K), ARF10 (L), ARF16 (M), ARF17 (N), DRB1 (O), DRB2 (P), and DRB4 (Q). (BQ) All phenotypic and molecular analyses relied on the use of three biological replicates with each biological replicate consisting of a pool of six plants. Altered development (BE) or a change in transcript abundance (FQ) was determined via comparison of the drb1/0.1 μM and drb1/1.0 μM treated samples to the values obtained for the untreated drb1/0.0 μM control sample by a standard two-tailed t-test. Error bars represent the standard error of the mean (SEM) and an asterisk (*) shows * p ≤ 0.05, ** p ≤ 0.01, *** p ≤ 0.001.
Figure 3
Figure 3
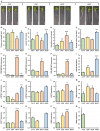
Phenotypic and molecular analysis of 21-day-old drb2 plants treated with 2,4-D. (A) Representative phenotypes displayed by 21-day-old drb2 control plants or following their treatment with 0.1 μM and 1.0 μM 2,4-D. Scale bar = 1.0 cm. (BE) Quantification of primary root length (B), lateral root number (C), adventitious root number (D), and rosette leaf surface area (E) of 21-day-old drb2 control plants or following treatment of drb2 plants with 0.1 μM and 1.0 μM 2,4-D. (FQ) Molecular analysis of all components of the miR160 expression module in the roots of drb2/0.0 μM, drb2/0.1 μM and drb2/1.0 μM plants, including assessment of the expression of PRE-MIR160A (F), PRE-MIR160B (G), PRE-MIR160C (H), miR160 (I), eTM160-1 (J), eTM160-2 (K), ARF10 (L), ARF16 (M), ARF17 (N), DRB1 (O), DRB2 (P), and DRB4 (Q). (BQ) All phenotypic and molecular analyses relied on the use of three biological replicates and each replicate consisted of a pool of six plants. Altered development (BE) or a change in transcript abundance (FQ) was determined via comparison of the drb2/0.1 μM and drb2/1.0 μM treated samples to the values obtained for the drb2/0.0 μM control sample by a standard two-tailed t-test. Error bars represent the standard error of the mean (SEM) and an asterisk (*) shows * p ≤ 0.05, ** p ≤ 0.01, *** p ≤ 0.001.
Figure 4
Figure 4
Phenotypic and molecular analysis of 21-day-old drb12 plants treated with 2,4-D. (A) Phenotypes displayed by 21-day-old drb12 control plants or following their treatment with 0.1 μM and 1.0 μM 2,4-D. Scale bar = 1.0 cm. (BE) Quantification of primary root length (B), lateral root number (C), adventitious root number (D), and rosette leaf surface area (E) of 21-day-old drb12/0.0 μM, drb12/0.1 μM and drb12/μM plants. (FQ) Molecular analysis of all miR160 expression module components in the roots of 21-day-old drb12/0.0 μM, drb12/0.1 μM and drb12/μM plants, including assessing PRE-MIR160A (F), PRE-MIR160B (G), PRE-MIR160C (H), miR160 (I), eTM160-1 (J), eTM160-2 (K), ARF10 (L), ARF16 (M), ARF17 (N), DRB1 (O), DRB2 (P), and DRB4 (Q) expression. (BQ) All phenotypic and molecular analyses relied on the use of three biological replicates and each replicate consisted of a pool of six plants. Altered development (BE) or a change in transcript abundance (FQ) was determined via comparison of the drb12/0.1 μM and drb12/1.0 μM samples to the values obtained for the drb12/0.0 μM control sample by a standard two-tailed t-test. Error bars represent the standard error of the mean (SEM) and an asterisk (*) shows * p ≤ 0.05, ** p ≤ 0.01, *** p ≤ 0.001.
Figure 5
Figure 5
Molecular characterization of the miR160 expression module in the roots of 21-day-old Col-0, drb4, drb14, and drb24 plants. (A) Representative phenotypes displayed by 21-day-old Col-0, drb4, drb14, and drb24 plants. Scale bar = 1.0 cm. (BE) Quantification of primary root length (B), lateral root number (C), adventitious root number (D), and rosette leaf surface area (E) of 21-day-old Col-0, drb4, drb14, and drb24 plants. (FQ) Molecular analysis of all components of the miR160 expression module in the roots of 21-day-old Col-0, drb4, drb14, and drb24 plants, including profiling the expression of PRE-MIR160A (F), PRE-MIR160B (G), PRE-MIR160C (H), miR160 (I), eTM160-1 (J), eTM160-2 (K), ARF10 (L), ARF16 (M), ARF17 (N), DRB1 (O), DRB2 (P), and DRB4 (Q). (BQ) All phenotypic and molecular analyses relied on the use of three biological replicates with each replicate consisting of a pool of six plants. Altered development (BE) or a change in transcript abundance (FQ) was determined via comparison of the drb4, drb14, and drb24 samples to the values obtained for Col-0 plants by a standard two-tailed t-test. Error bars represent the standard error of the mean (SEM) and an asterisk (*) shows * p ≤ 0.05, ** p ≤ 0.01, *** p ≤ 0.001.

Similar articles

Cited by

References

    1. Ruegger M., Dewey E., Gray W.M., Hobbie L., Turner J., Estelle M. The TIR1 protein of Arabidopsis functions in auxin response and is related to human SKP2 and yeast grr1p. Genes. 1998;12:198–207. doi: 10.1101/gad.12.2.198. - DOI - PMC - PubMed
    1. Guilfoyle T.J., Hagen G. Auxin response factors. Curr. Opin. Plant Biol. 2007;10:453–460. doi: 10.1016/j.pbi.2007.08.014. - DOI - PubMed
    1. Kepinski S., Leyser O. Auxin-induced SCFTIR1-Aux/IAA interaction involves stable modification of the SCFTIR1 complex. Proc. Natl. Acad. Sci. USA. 2004;101:12381–12386. doi: 10.1073/pnas.0402868101. - DOI - PMC - PubMed
    1. Reed J.W. Roles and activities of Aux/IAA proteins in Arabidopsis. Trends Plant Sci. 2001;6:420–425. doi: 10.1016/S1360-1385(01)02042-8. - DOI - PubMed
    1. Luo J., Zhou J.J., Zhang J.Z. Aux/IAA Gene Family in Plants: Molecular Structure, Regulation, and Function. Int. J. Mol. Sci. 2018;19:259. doi: 10.3390/ijms19010259. - DOI - PMC - PubMed

MeSH terms

LinkOut - more resources