. 2024 Dec 12;13(24):4025.
doi: 10.3390/foods13244025.

Integrated Transcriptome and Metabolome Analysis Reveals Mechanism of Flavonoid Synthesis During Low-Temperature Storage of Sweet Corn Kernels

Affiliations

Integrated Transcriptome and Metabolome Analysis Reveals Mechanism of Flavonoid Synthesis During Low-Temperature Storage of Sweet Corn Kernels

Jingyan Liu et al. Foods. .

Abstract

Sweet corn is a globally important food source and vegetable renowned for its rich nutritional content. However, post-harvest quality deterioration remains a significant challenge due to sweet corn's high sensitivity to environmental factors. Currently, low-temperature storage is the primary method for preserving sweet corn; however, the molecular mechanisms involved in this process remain unclear. In this study, kernels stored at different temperatures (28 °C and 4 °C) for 1, 3, and 5 days after harvest were collected for physiological and transcriptomic analysis. Low temperature storage significantly improved the PPO and SOD activity in sweet corn kernels compared to storage at a normal temperature. A total of 1993 common differentially expressed genes (DEGs) were identified in kernels stored at low temperatures across all three time points. Integrated analysis of transcriptomic and previous metabolomic data revealed that low temperature storage significantly affected flavonoid biosynthesis. Furthermore, 11 genes involved in flavonoid biosynthesis exhibited differential expression across the three storage periods, including CHI, HCT, ANS, F3'H, F3'5'H, FLS, and NOMT, with Eriodictyol, Myricetin, and Hesperetin-7-O-glucoside among the key flavonoids. Correlation analysis revealed three AP2/ERF-ERF transcription factors (EREB14, EREB182, and EREB200) as potential regulators of flavonoid biosynthesis during low temperature treatment. These results enhance our understanding of the mechanisms of flavonoid synthesis in sweet corn kernels during low-temperature storage.

Keywords: flavonoid synthesis; integrated analysis; low-temperature storage; sweet corn; transcriptome.


Conflict of interest statement

The authors declare no conflicts of interest.

Figures

Figure 1
Figure 1
Effects of low temperature on sweet corn kernels at different storage times. (A) Appearance changes of kernels between low temperature (down) and control temperature (up). D1, D3, and D5 represent days of storage (1, 3, and 5). F and N represent low and normal temperatures, respectively. Scale bar = 1 cm. (B) Changes of enzyme activities at low temperatures in sweet corn kernels. Asterisks indicate significant differences between two temperatures based on two-tailed Student’s t-test (** p < 0.01, “ns” indicates no significant difference).
Figure 2
Figure 2
An overview of transcriptomic profiles in sweet corn kernels. (A) PCA of gene expression levels (FPKM) in sweet corn kernels at different storage temperatures. Each dot represents an independent experimental repeat, with three biological replicates. (B) A Venn diagram showing the distribution of expressed genes at different storage temperatures. The special and core genes are shown in the diagram.
Figure 3
Figure 3
A summary of all differentially expressed genes (DEGs) between low temperatures and normal temperatures in sweet corn kernels during storage. (A) A heatmap of all the DEGs. The red and blue blocks indicate the high abundance and low abundance genes, respectively. (B) A Venn diagram showing the distribution of the DEGs at different storage times. (CE) Volcano plots showing DEGs at different storage times. Red and green dots represented upregulated and downregulated genes, respectively. (F) Expression patterns of DEGs by K-means clustering analysis.
Figure 4
Figure 4
Enrichment analysis of common DEGs and common DAMs in sweet corn kernels during storage. (A) GO enrichment analysis of common DEGs. The dot size represented the number of genes in each pathway. The Padj represented the adjusted p-value of the enrichment analysis. (B) KEGG enrichment analysis combined common DEGs and common DAMs. The top 20 terms were selected based on transcriptome analysis. The triangles represent the transcriptome analysis, while the dots represented the metabolome analysis. The size represents the number of metabolites detected in this study and the color represents the p-value of enrichment analysis.
Figure 5
Figure 5
Integrated transcriptomic and metabolomics data reveal the changes in the flavonoid biosynthesis pathway in sweet corn kernels during low-temperature storage. The red and blue chemicals represent the up-accumulated and the down-accumulated metabolites, respectively. Eleven DEGs are highlighted in the green box. Red represents upregulated genes, while blue represents downregulated genes. More detailed information for these genes is listed in Table S6.
Figure 6
Figure 6
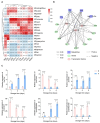
The potential gene regulation network of the flavonoid biosynthesis pathway in sweet corn kernels during low-temperature storage. (A) The construction of a regulation module for 11 DEGs’ expression using weighted correlation network analysis (WGCNA). Each row represents a module eigengene, while the column represents the gene expression pattern. (B) The networks were established from the Pearson correlation coefficient (PCC) correlation among metabolites, genes, and transcription factors of the flavonoid biosynthesis pathway. The thickness of the line represents the correlation value, while the solid and dotted lines represent positive and negative correlations, respectively. (C) The relative expression of marker genes in sweet corn during different storage times. F and N represent low and normal temperatures, respectively. Asterisks indicate differences in gene expression between two temperatures based on a two-tailed Student’s t-test (* p < 0.05, *** p < 0.001, **** p < 0.0001, “ns” indicates no significant difference).

Similar articles

References

    1. Liu F., Xiang N., Hu J.G., Shijuan Y., Xie L., Brennan C.S., Huang W., Guo X. The manipulation of gene expression and the biosynthesis of Vitamin C, E and folate in light-and dark-germination of sweet corn seeds. Sci. Rep. 2017;7:7484. doi: 10.1038/s41598-017-07774-9. - DOI - PMC - PubMed
    1. Messias Rda S., Galli V., Silva S.D., Schirmer M.A., Rombaldi C.V. Micronutrient and functional compounds biofortification of maize grains. Crit. Rev. Food Sci. Nutr. 2015;55:123–139. doi: 10.1080/10408398.2011.649314. - DOI - PubMed
    1. Hu Y., Colantonio V., Muller B.S.F., Leach K.A., Nanni A., Finegan C., Wang B., Baseggio M., Newton C.J., Juhl E.M., et al. Genome assembly and population genomic analysis provide insights into the evolution of modern sweet corn. Nat. Commun. 2021;12:1227. doi: 10.1038/s41467-021-21380-4. - DOI - PMC - PubMed
    1. Jan B., Anwar Bhat M., Bhat T.A., Yaqoob M., Nazir A., Ashraf Bhat M., Mir A.H., Wani F.J., Kumar Singh J., Kumar R., et al. Evaluation of seedling age and nutrient sources on phenology, yield and agrometeorological indices for sweet corn (Zea mays saccharata L.) Saudi J. Biol. Sci. 2022;29:735–742. doi: 10.1016/j.sjbs.2021.10.010. - DOI - PMC - PubMed
    1. Tas T., Mutlu A. Morpho-physiological effects of environmental stress on yield and quality of sweet corn varieties (Zea mays L.) PeerJ. 2021;9:e12613. doi: 10.7717/peerj.12613. - DOI - PMC - PubMed

LinkOut - more resources