. 2024 Dec 13;13(24):4028.
doi: 10.3390/foods13244028.

Mitigating Oxidative Stress and Promoting Cellular Longevity with Mushroom Extracts

Affiliations

Mitigating Oxidative Stress and Promoting Cellular Longevity with Mushroom Extracts

Menna-Allah E Abdelkader et al. Foods. .

Abstract

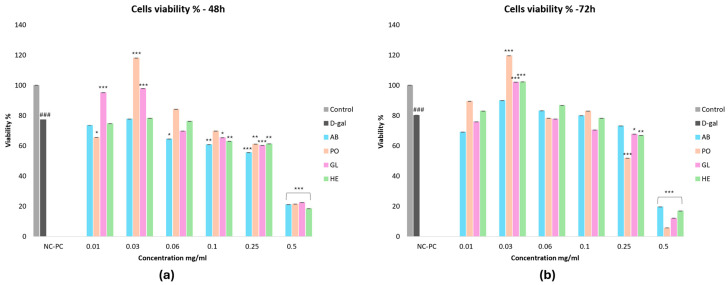
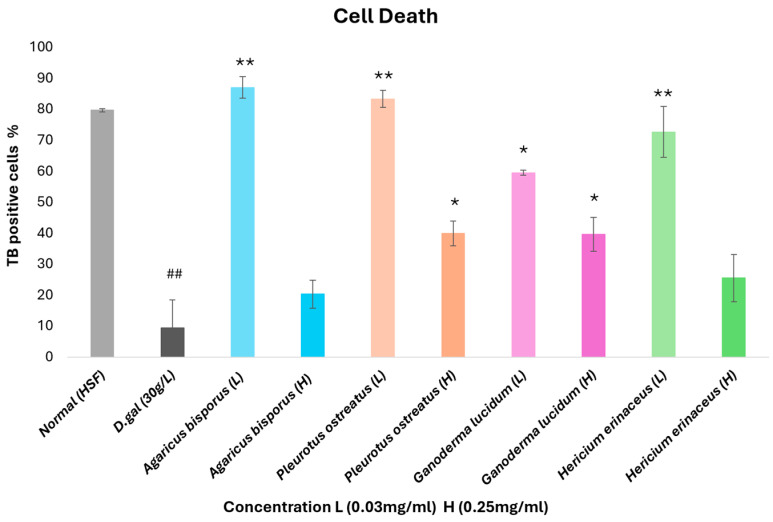
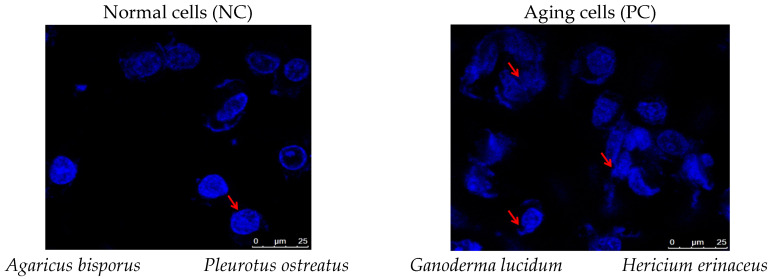
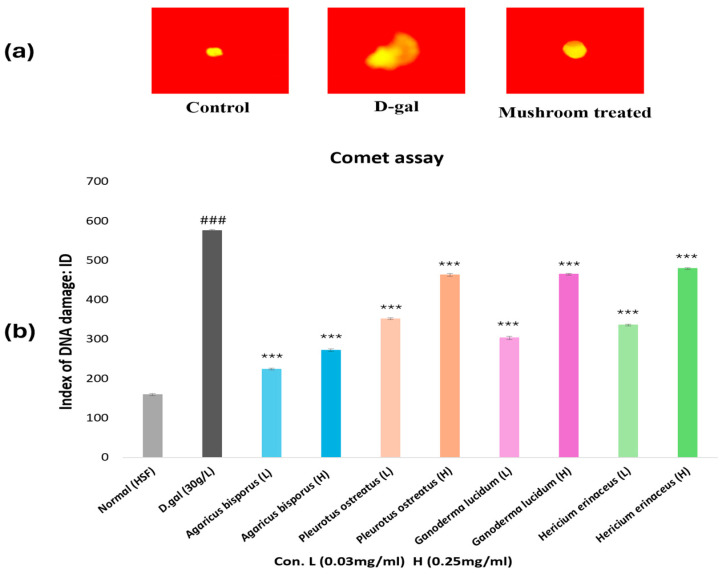
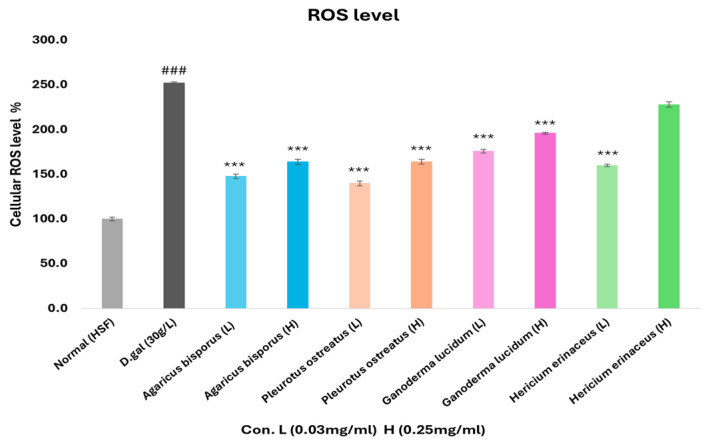
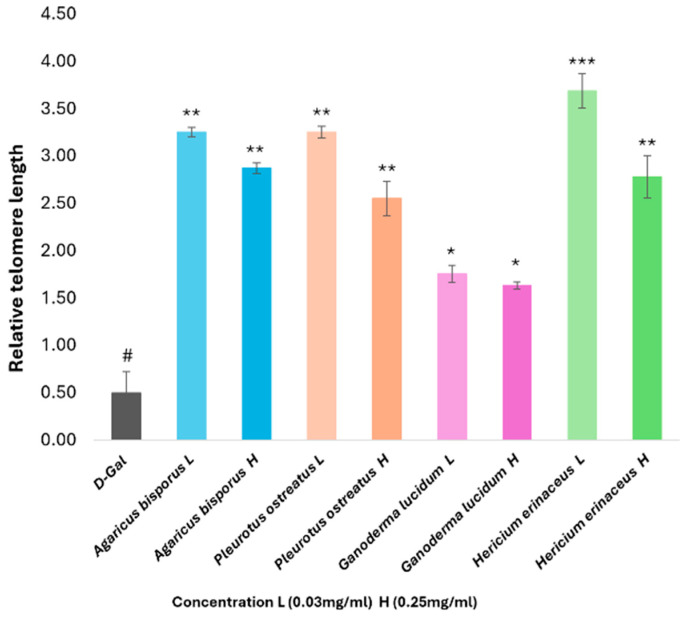
Oxidative stress can disrupt the body's ability to fight harmful free radicals, leading to premature aging and various health complications. This study investigated the antioxidant and anti-aging properties of four medicinal and edible mushrooms: Ganoderma lucidum, Hericium erinaceus, Pleurotus ostreatus, and Agaricus bisporus. The antioxidant activity of mushroom extracts was evaluated using (DPPH-ABTS-Reducing power). The anti-aging effects were assessed using Human Skin Fibroblasts (HSF) cells subjected to D-galactose-induced aging (30 g/L/72 h) and treated with mushroom extracts (0.03-0.25 mg/mL/72 h). The results demonstrated that all mushrooms have significant antioxidant and anti-aging properties, with low concentrations of extracts (0.03 mg/mL) effectively promoting cell proliferation at an 87% rate in the Agaricus bisporus extract, enhancing cell cycle progression by reducing the arrested cells in the G0/G1 phase to 75%, and promoting DNA synthesis in S phase by more than 16.36% in the Hericium erinaceus extract. Additionally, the extracts reduced DNA damage and Reactive Oxygen Species (ROS) levels, protecting cells from oxidative stress and potentially contributing to anti-aging effects. The mushrooms also exhibited immunomodulatory and anti-inflammatory effects by upregulating the IL-2, IL-4, and downregulating IL-6 expression, indicating their potential to promote general health. These findings suggest the potential of mushroom extracts as natural agents for reducing the negative effects of aging while promoting cellular health. Further research is required to explore the specific bioactive compounds responsible for these beneficial effects and to evaluate their efficacy in vivo.

Keywords: D-gal; DNA damage; IL-genes; ROS; anti-aging; antioxidants; cell cycle; mushroom; telomere length.


Conflict of interest statement

The authors declare no conflicts of interest in this work.

Figures

Figure 1
Figure 1
Illustration of the timeline of the cell line experiment. The HSF cells were exposed to 30 g/L D-gal for 72 h to induce aging, then treated with four species of mushroom extracts (0.50 to 0.01 mg/mL) for 48 and 72 h. MTT was used to determine the cell viability after 48 and 72 h. After that, 0.25 and 0.03 mg/mL were used as high and low concentrations of mushroom extracts for a 72 h experiment period. After cell harvesting, cell death, cell morphology, cell cycle, DNA damage, ROS level, and gene expression were determined.
Figure 2
Figure 2
DPPH and ABTS+ radical scavenging activity and reducing power absorbance of different mushroom extracts. Where (a) DPPH, (b) ABTS+•, and (c) reducing power (FRAP). AS (ascorbic acid) (0.005, 0.01, 0.02 mg/mL), AB (Agaricus bisporus), PO (Pleurotus ostreatus), GL (Ganoderma lucidum), and HE (Hericium erinaceus) extracts (0.005–0.1 mg/mL). Data are presented as the mean ± SD. Differences that show statistical significance at * p < 0.05.
Figure 3
Figure 3
Cell viability percentage of normal HSF cells, aging cells induced by D-gal (30 g/L/48,72 h), and aging cells treated with different mushroom extracts at various doses (0.50–0.01 mg/mL) for 48 h and 72 h. (a) The viability after 48 h. (b) The viability after 72 h. Data are presented as the mean ± SD. Differences that show statistical significance at * p < 0.05, ** p < 0.01, and *** p < 0.001 compared with the D-gal group, and ### p < 0.001 compared with the control group.
Figure 4
Figure 4
Cell death induced by D-gal and the effect of different mushroom extracts on aging cells. Trypan blue (TB) was used to stain adherent and floating cells, and the TB-positive cells were presented as a percentage. L (low concentration: 0.03 mg/mL), H (high concentration: 0.25 mg/mL). Data are presented as the mean ± SD. Differences that show statistical significance at * p < 0.05 and ** p < 0.01 compared with the D-gal group, and ## p < 0.01 compared with the control group.
Figure 5
Figure 5
Morphological cell changes of normal HSF cells and aged HSF cells induced by D-gal 30 g/L/72 h and after being treated with different mushroom extracts at various concentrations (0.25–0.03 mg/mL/72 h), under the inverted phase-contrast microscope at 5× magnification, the changes are illustrated by arrows. The normal cells were observed to grow normally with a spindle shape and even distribution, while aging cells showed abnormal behavior with a wider shape, increased space between the cells, and increased senescent cells. The cells treated with the high concentration (0.25 mg/mL/72 h) expressed abnormal shapes and fewer cells, but the cells treated with the low concentration (0.03 mg/mL/72 h) showed normal growth with normal shape and even distribution.
Figure 6
Figure 6
Nuclear morphology of normal HSF cells, aged HSF cells induced by D-gal 30 g/L/72 h, and after treatment with different mushroom extracts at various concentrations (0.25–0.03 mg/mL/72 h). Examined under a confocal microscope at 63× magnification after being stained with Hoechst 33342 stain, the changes are illustrated by arrows. The normal HSF cells showed normal nucleus shape, while the aging cells observed abnormal shapes of the nucleus and cells, a shrunken-shaped nucleus, DNA fragmentation, and chromatin clumping. The aging cells treated with the high concentration (0.25 mg/mL/72 h) did not show significant improvement, but the aging cells treated with low concentration (0.03 mg/mL/72 h) showed normal morphology of nuclei with round, regular shapes.
Figure 6
Figure 6
Nuclear morphology of normal HSF cells, aged HSF cells induced by D-gal 30 g/L/72 h, and after treatment with different mushroom extracts at various concentrations (0.25–0.03 mg/mL/72 h). Examined under a confocal microscope at 63× magnification after being stained with Hoechst 33342 stain, the changes are illustrated by arrows. The normal HSF cells showed normal nucleus shape, while the aging cells observed abnormal shapes of the nucleus and cells, a shrunken-shaped nucleus, DNA fragmentation, and chromatin clumping. The aging cells treated with the high concentration (0.25 mg/mL/72 h) did not show significant improvement, but the aging cells treated with low concentration (0.03 mg/mL/72 h) showed normal morphology of nuclei with round, regular shapes.
Figure 7
Figure 7
Cell cycle distribution of normal HSF cells and aging cells induced by D-gal (30 g/L/72 h) and aging cells treated with different mushroom extracts. (a): Normal HSF cells, NC (Negative control), (b): D-gal group, PC (Positive control), (c): AB (Agaricus bisporus) (0.25 mg/mL/72 h), (d): AB (0.03mg/mL/72 h), (e): PO (Pleurotus ostreatus) (0.25 mg/mL/72 h), (f): PO (0.03 mg/mL/72 h), (g): GL (Ganoderma lucidum) (0.25 mg/mL/72 h), (h): GL (0.03 mg/mL/72 h), (i): HE (Hericium erinaceus) (0.25 mg/mL/72 h), (j): HE (0.03 mg/mL/72 h). The aging HSF cells showed an increase of arrested cells at the G0/G1 phase by 82.36%, while after being treated with mushroom extracts exhibited a decrease in cell arrest at the G0/G1 phase with approximately 75% gated cells and enhanced the synthesis of DNA by increasing the cells at the S phase where the highest percentage was 16.36% in the HE extract (0.03 mg/mL).
Figure 7
Figure 7
Cell cycle distribution of normal HSF cells and aging cells induced by D-gal (30 g/L/72 h) and aging cells treated with different mushroom extracts. (a): Normal HSF cells, NC (Negative control), (b): D-gal group, PC (Positive control), (c): AB (Agaricus bisporus) (0.25 mg/mL/72 h), (d): AB (0.03mg/mL/72 h), (e): PO (Pleurotus ostreatus) (0.25 mg/mL/72 h), (f): PO (0.03 mg/mL/72 h), (g): GL (Ganoderma lucidum) (0.25 mg/mL/72 h), (h): GL (0.03 mg/mL/72 h), (i): HE (Hericium erinaceus) (0.25 mg/mL/72 h), (j): HE (0.03 mg/mL/72 h). The aging HSF cells showed an increase of arrested cells at the G0/G1 phase by 82.36%, while after being treated with mushroom extracts exhibited a decrease in cell arrest at the G0/G1 phase with approximately 75% gated cells and enhanced the synthesis of DNA by increasing the cells at the S phase where the highest percentage was 16.36% in the HE extract (0.03 mg/mL).
Figure 8
Figure 8
Comet assay analysis of aging cells induced by D-gal (30 g/L/72 h) and aging HSF cells treated with mushroom extracts, where L: (0.03 mg/mL/72 h), H: (0.25 mg/mL/72 h). (a): The HSF cell’s shape under the fluorescence microscope after staining with ethidium bromide presented the different types of DNA damage, (b): Chart of the DNA-damaged index. The data are presented as the mean ± SD. Differences that show statistical significance at *** p < 0.001 compared with the D-gal group, ### p < 0.001 compared with the control group.
Figure 9
Figure 9
Reactive oxygen species (ROS) levels of aging HSF cells induced by D-gal (30g/L/72 h), and after being treated with different mushroom extracts (0.03 and 0.25 mg/mL) for 72 h. It was determined by ELISA assay. The data are presented as the mean ± SD. Differences that show statistical significance at *** p < 0.001 compared with the D-gal group, ### p < 0.001 compared with the control group.
Figure 10
Figure 10
Influence of four mushroom extracts on the levels of cytokine mRNA expression of IL-2, IL-4, and IL-6 in the aging HSF cells induced by D-gal (30 g/L/72 h) and after being treated with different mushroom extracts (0.03–0.025 mg/mL/72 h). The data are presented as the mean ± SD. Differences that show statistical significance at * p < 0.05, ** p < 0.01, and *** p < 0.001 compared with the D-gal group, and ## p < 0.01 compared with the control group.
Figure 11
Figure 11
Influence of four mushroom extracts on the relative telomere length of aging HSF cells induced by D-gal (30 g/L/72 h) after being treated with different mushroom extracts (0.03–0.25 mg/mL/72 h). The data are presented as the mean ± SD. Differences that show statistical significance at * p < 0.05, ** p < 0.01, and *** p < 0.001 compared with the D-gal group, #p < 0.05 compared with the control group.

Similar articles

Cited by

References

    1. Mallikarjuna S.E., Ranjini A., Haware D.J., Vijayalakshmi M.R., Shashirekha M.N., Rajarathnam S. Mineral Composition of Four Edible Mushrooms. J. Chem. 2013;2013:805284. doi: 10.1155/2013/805284. - DOI
    1. Sevindik M., Akgul H., Selamoglu Z., Braidy N. Antioxidant and Antigenotoxic Potential of Infundibulicybe Geotropa Mushroom Collected from Northwestern Turkey. Oxid. Med. Cell Longev. 2020;2020:5620484. doi: 10.1155/2020/5620484. - DOI - PMC - PubMed
    1. Li H., Liu X., Li Y., Hua Y., Zhi D., Pang G. Effects of the Polysaccharide from Pholiota Nameko on Human Cytokine Network in Serum. Int. J. Biol. Macromol. 2012;50:164–170. doi: 10.1016/j.ijbiomac.2011.10.015. - DOI - PubMed
    1. Shibu M.A., Agrawal D.C., Huang C.-Y. Springer; Singapore: 2017. Mushrooms: A Pandora Box of Cardioprotective Phytochemicals. Medicinal Plants and Fungi: Recent Advances in Research and Development.
    1. Liu F., Ooi V.E.C., Chang S.T. Free Radical Scavenging Activities of Mushroom Polysaccharide Extracts. Life Sci. 1997;60:763–771. doi: 10.1016/S0024-3205(97)00004-0. - DOI - PubMed

LinkOut - more resources