

Sociodemographic and Population Exposure to Upstream Oil and Gas Operations in Canada
- PMID: 39767531
- PMCID: PMC11675219
- DOI: 10.3390/ijerph21121692
Sociodemographic and Population Exposure to Upstream Oil and Gas Operations in Canada
Abstract
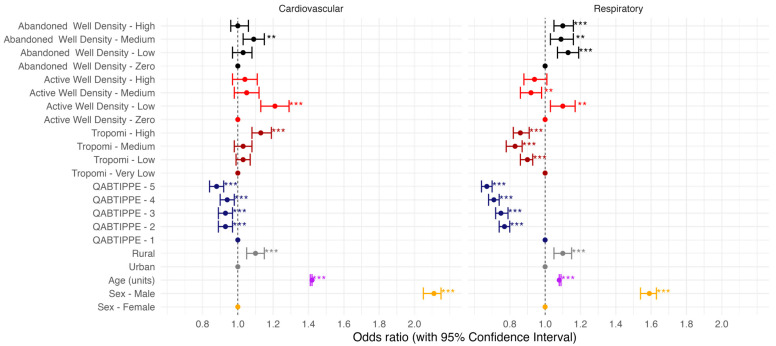
Canada, as one of the largest oil and gas producer in the world, is responsible for large emissions of methane, a powerful greenhouse gas. At low levels, methane is not a direct threat to human health; however, human health is affected by exposure to pollutants co-emitted with methane. The objectives of this research were to estimate and map pollutants emitted by the oil and gas industry, to assess the demographic of the population exposed to oil and gas activities, and to characterize the impact of well density on cardiovascular- and respiratory-related outcomes with a focus on Alberta. We estimated that ~13% and 3% people in Alberta reside, respectively, within 1.5 km of an active well and 1.5 km of a flare. Our analysis suggests that racial and socioeconomic disparities exist in residential proximity to active wells, with people of Aboriginal identity and people with less education being more exposed to active wells than the general population. We found increased odds of cardiovascular-related (1.13-1.29 for low active well density) and respiratory-related (1.07-1.19 for low active well density) outcomes with exposure to wells. Close to 100 countries produce oil and gas, making this a global issue. There is an important need for additional studies from other producing jurisdictions outside the United States.
Keywords: CanCHEC; DAD; air pollutants; air quality; methane; nitrous oxide; oil and gas.
Conflict of interest statement
The authors declare no conflicts of interest. The funders had no role in the design of the study; the collection, analyses, or interpretation of data; the writing of the manuscript; or the decision to publish the results.
Figures


References
-
- IPCC . Contribution of Working Group I to the Sixth Assessment Report of the Intergovernmental Panel on Climate Change 2021. Cambridge University Press; Cambridge, UK: New York, NY, USA: 2023. IPCC Climate Change 2021: The Physical Science Basis.
-
- Garcia-Gonzales D.A., Shonkoff S.B.C., Hays J., Jerrett M. Hazardous Air Pollutants Associated with Upstream Oil and Natural Gas Development: A Critical Synthesis of Current Peer-Reviewed Literature. Annu. Rev. Public Health. 2019;40:283–304. doi: 10.1146/annurev-publhealth-040218-043715. - DOI - PubMed
-
- Warneke C., Geiger F., Edwards P.M., Dube W., Pétron G., Kofler J., Zahn A., Brown S.S., Graus M., Gilman J.B., et al. Volatile Organic Compound Emissions from the Oil and Natural Gas Industry in the Uintah Basin, Utah: Oil and Gas Well Pad Emissions Compared to Ambient Air Composition. Atmos. Chem. Phys. 2014;14:10977–10988. doi: 10.5194/acp-14-10977-2014. - DOI
MeSH terms
Substances
Grants and funding
LinkOut - more resources
Full Text Sources
