. 2024 Nov 21;12(12):2654.
doi: 10.3390/biomedicines12122654.

Chronic Sleep Deprivation Causes Anxiety, Depression and Impaired Gut Barrier in Female Mice-Correlation Analysis from Fecal Microbiome and Metabolome

Affiliations

Chronic Sleep Deprivation Causes Anxiety, Depression and Impaired Gut Barrier in Female Mice-Correlation Analysis from Fecal Microbiome and Metabolome

Lingyue Li et al. Biomedicines. .

Abstract

Background: Chronic sleep deprivation (CSD) plays an important role in mood disorders. However, the changes in the gut microbiota and metabolites associated with CSD-induced anxiety/depression-like behavior in female mice have not been determined. Due to the influence of endogenous hormone levels, females are more susceptible than males to negative emotions caused by sleep deprivation. Here, we aim to investigate how CSD changes the gut microbiota and behavior and uncover the relationship between CSD and gut microbiota and its metabolites in female mice.

Methods: We used a 48-day sleep deprivation (SD) model using the modified multiple platform method (MMPM) to induce anxiety/depression-like behavior in female C57BL/6J mice and verified our results using the open field test, elevated plus maze, novel object recognition test, forced swim test, and tail suspension test. We collected fecal samples of mice for 16S rDNA sequencing and untargeted metabolomic analysis and colons for histopathological observation. We used Spearmen analysis to find the correlations between differential bacterial taxa, fecal metabolites, and behaviors.

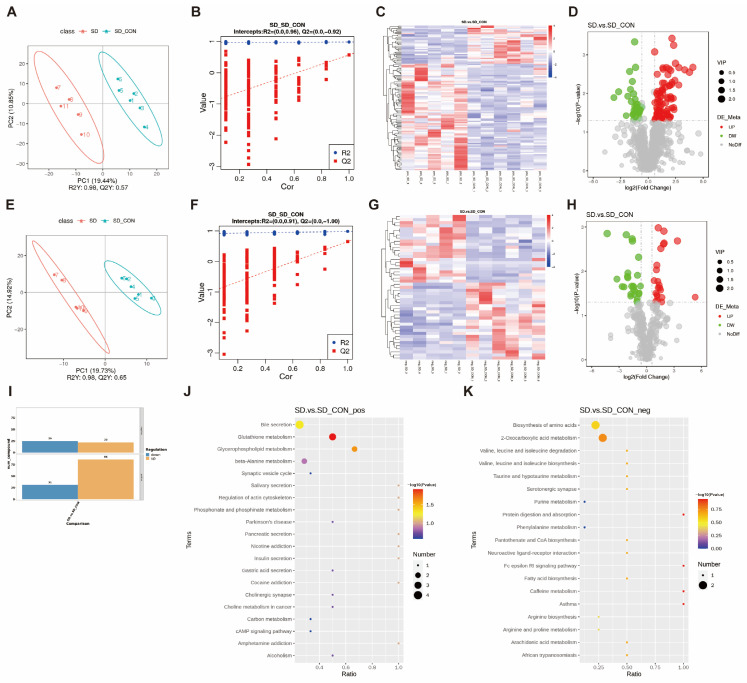
Results: Our study demonstrates that CSD induced anxiety/depressive-like behaviors in female mice. The results of 16S rDNA sequencing suggested that the relative abundance of the harmful bacteria g_ Rothia, g_ Streptococcus, g_ Pantoea, and g_ Klebsiella were significantly increased, while the beneficial bacteria g_ Rikenella, g_ Eubacterium]-xylanophilum-group, and g_ Eisenbergiella were significantly decreased after SD. Glycerophospholipid metabolism and glutathione metabolism were identified as key pathways in the fecal metabolism related to oxidative stress and inflammatory states of the intestine. Histological observation showed hyperplasia of epithelial cells, a decrease in goblet cells, and glandular atrophy of the colon in SD mice. There were correlations between some of the differential bacterial taxa, fecal metabolites, and behaviors.

Conclusion: In summary, we found that CSD induced anxiety/depression-like behavior, caused gut microbiota dysbiosis, altered fecal metabolism, and damaged the colon barrier in female mice.

Keywords: anxiety-like behavior; colon barrier; depression-like behavior; female; gut microbiota; sleep deprivation.


Conflict of interest statement

The authors declare no conflict of interest.

Figures

Figure 1
Figure 1
SD procedure and behavior test. (A) Schematic design of 48-d SD procedure and behavior test. (B) Diagram of the MMPM. (C) Representative tracking plot from the OFT. (DF) Total distance (unpaired t-test, n = 4/5 per group), central square duration (unpaired t-test, n = 4 per group), and the number of entries in the center (unpaired t-test, n = 5 per group) during the OFT. (G) Representative track plot of the EPM test. (HJ) Time spent in the open arms (unpaired t-test), the number of entries in the open arms (unpaired t-test), and the anxiety index during the EPM test (unpaired t-test, n = 5 per group). (K) Diagram of the NORT. The green polyhedron represents familiar object, the red cube represents the novel object. (L) Recognition index of NORT (unpaired t-test, n = 4 per group). (M) Diagram of the FST. (N) Immobility time during FST (unpaired t-test, n = 5 per group). (O) Diagram of the TST. (P) Immobility time during TST (unpaired t-test, n = 5 per group). All data are presented as mean ± SEM. * p < 0.05, ** p < 0.01 and *** p < 0.001.
Figure 2
Figure 2
Colon pathological analysis. (A) Hematoxylin and eosin (H&E) staining. Bar = 300 μm and 60 μm. (B) Scores of histological changes in H&E staining (n = 3). (C) Alcian Blue Periodic Acid Schiff (AB-PAS) Staining. Bar = 300 μm and 200 μm. (D) Goblet cell counting of AB-PAS staining (n = 3). All data are presented as mean ± SEM. ** p < 0.01.
Figure 3
Figure 3
Fecal microbiome data analysis after SD. (A) Venn diagram. (B,C) In representative diagrams of alpha diversity, all alpha diversity indicators have no statistically significant differences. (D) Principal coordinates analysis (PcoA) plot using Bray–Curtis distance. (E) The ratio of relative abundances of phylum level. (F) The ratio of relative abundances of family level. (G) The ratio of relative abundances of genus level. (H) The top 10 species with a p-value less than 0.05 at the phylum level. (I) The top 10 species with a p-value less than 0.05 at the family level. (J) The top 10 species with a p-value less than 0.05 at the genus level.
Figure 4
Figure 4
Fecal metabolomics after SD. (A) Score plot of PLS-DA model in positive ion model. (B) Permutation plot in positive ion model. (C) Heatmap graph of differential metabolites in positive ion model, the metabolites are clustered according to the similarity of the metabolite expression profiles. (D) Volcano plot in positive ion model, showing the distribution of differential metabolites. (EH) Score plot of PLS-DA, permutation plot, heatmap graph, and volcano plot in negative ion model. (I) Differential metabolite statistics. (J,K) KEGG enrichment analysis of differential metabolites in positive ion model and negative ion model.
Figure 5
Figure 5
Correlation analysis between differential genera, metabolites, and behavioral indicators. (A,B) Correlation heatmap and correlation network between the top 10 genera with p-values less than 0.05 and metabolites in glycerophospholipid metabolism pathway and glutathione metabolism. (C) Correlation heatmap between the top 10 genera with p-values less than 0.05 and behavioral indicators. (D) Correlation heatmap between metabolites in glycerophospholipid metabolism pathway and glutathione metabolism and behavioral indicators. All data are presented as mean ± SEM. * p < 0.05, ** p < 0.01.

Similar articles

References

    1. Konakanchi S., Raavi V., Ml H.K., Shankar M.S.V. Effect of chronic sleep deprivation and sleep recovery on hippocampal CA3 neurons, spatial memory and anxiety-like behavior in rats. Neurobiol. Learn. Mem. 2022;187:107559. doi: 10.1016/j.nlm.2021.107559. - DOI - PubMed
    1. Hanson J.A., Huecker M.R. StatPearls [Internet] StatPearls Publishing; Treasure Island, FL, USA: 2024. [(accessed on 30 October 2023)]. Sleep Deprivation. Available online: http://www.ncbi.nlm.nih.gov/books/NBK547676/
    1. 2020_philips_wsd_report.pdf. [(accessed on 5 December 2023)]. Available online: https://www.philips.com/c-dam/b2c/zh_CN/experience/world-sleep-day/2020_....
    1. Han M., Yuan S., Zhang J. The interplay between sleep and gut microbiota. Brain Res. Bull. 2022;180:131–146. doi: 10.1016/j.brainresbull.2021.12.016. - DOI - PubMed
    1. Wang Z., Chen W.-H., Li S.-X., He Z.-M., Zhu W.-L., Ji Y.-B., Wang Z., Zhu X.-M., Yuan K., Bao Y.-P., et al. Gut microbiota modulates the inflammatory response and cognitive impairment induced by sleep deprivation. Mol. Psychiatry. 2021;26:6277–6292. doi: 10.1038/s41380-021-01113-1. - DOI - PubMed

LinkOut - more resources