

Injury Patterns and Associated Demographic Characteristics in Children with a Fracture from Equines: A US National Based Study
- PMID: 39767872
- PMCID: PMC11674967
- DOI: 10.3390/children11121443
Injury Patterns and Associated Demographic Characteristics in Children with a Fracture from Equines: A US National Based Study
Abstract
Background: Fractures often occur due to equestrian activities with injury patterns varying by age. The purpose of this study was to investigate in detail fracture patterns and associated demographics in children due to equine activities.
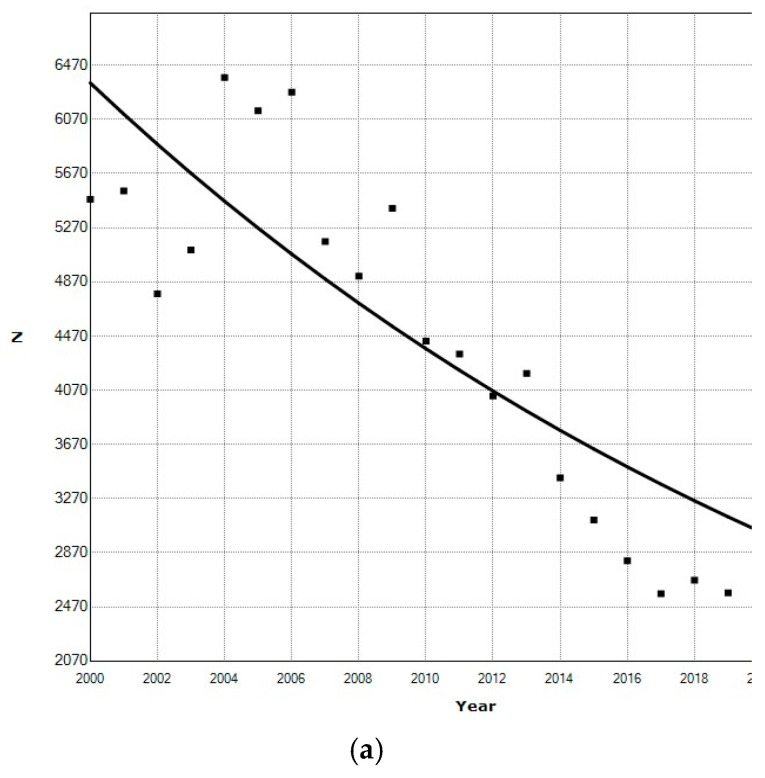
Materials: The US National Electronic Injury Surveillance System was queried for all injuries with the consumer product code 1239 (horseback riding) from 2000 to 2023. Those <16 years old with fractures were extracted. Statistical analyses were performed with SUDAAN 11.0.01™ software to obtain national estimates.
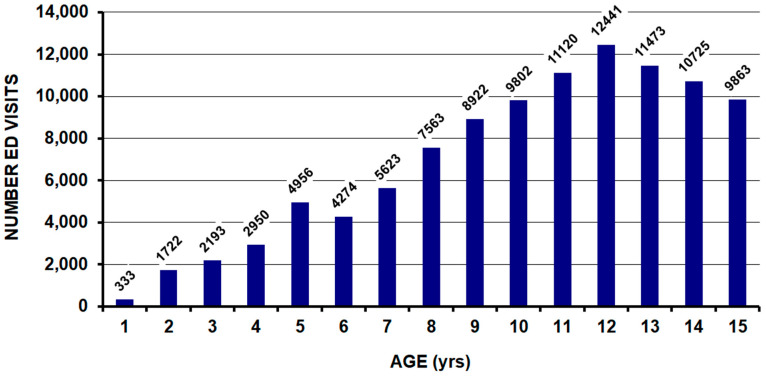
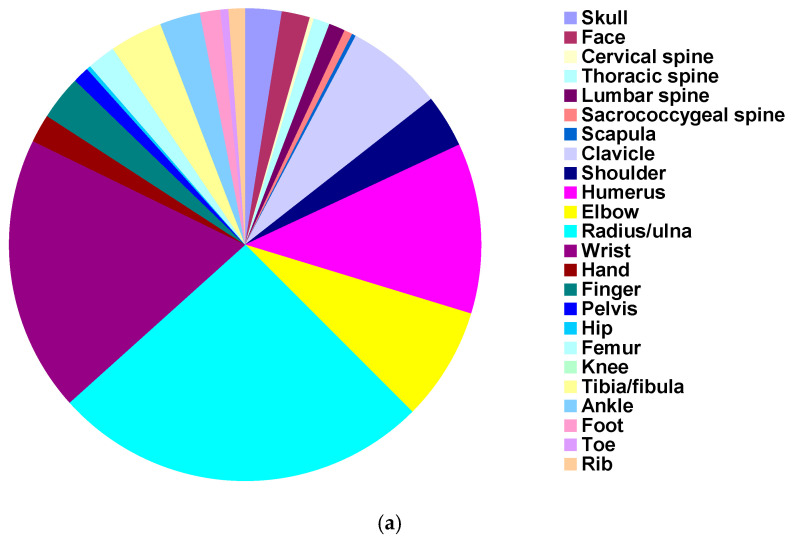
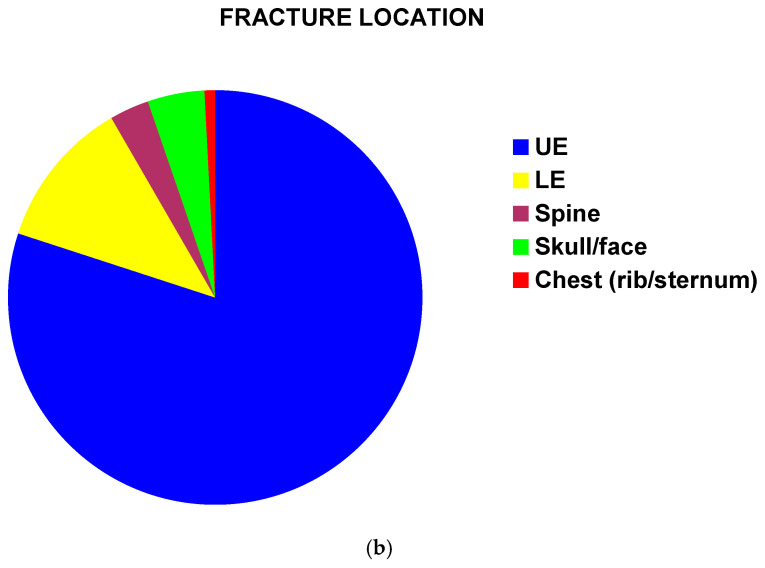
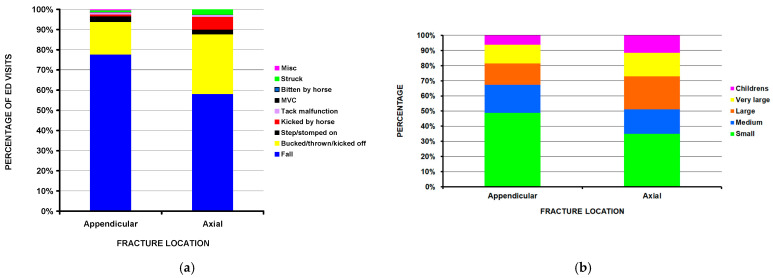
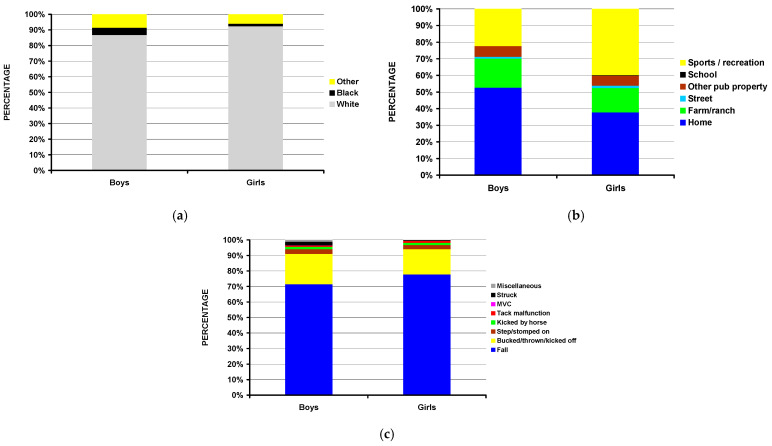
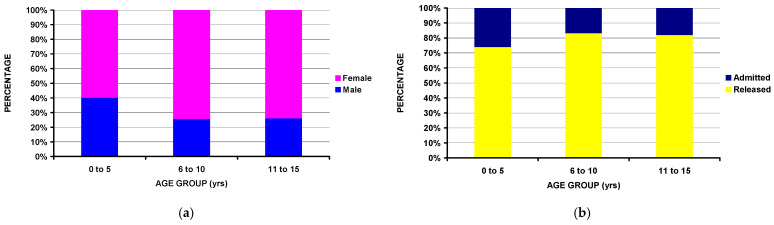
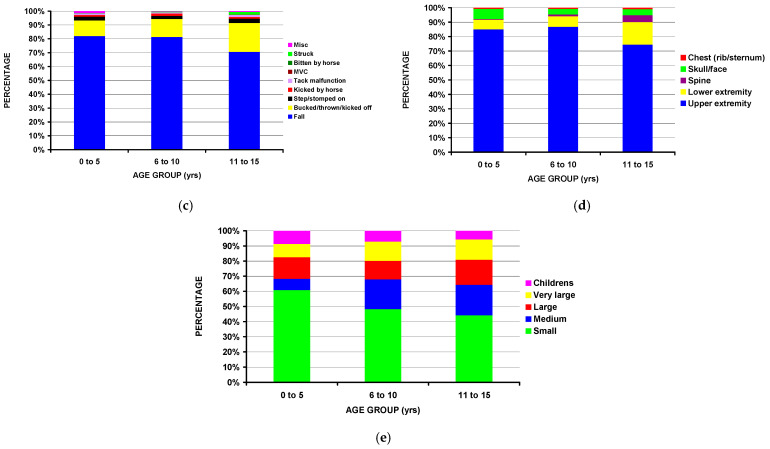
Results: There were an estimated 101,677 patients with a fracture. Girls comprised 72.5% and the patient was discharged from the hospital in 81.5% of cases. Fractures involved the upper extremity in 80,973 (80.0%), the pelvis/lower extremity in 11,794 (11.7%), the spine in 3060 (3.0%), the skull/face in 4321 (4.4%), and the rib/sternum in 940 (0.9%). The humerus, elbow, radius/ulna, and wrist accounted for 62.4% of all the fractures. The youngest age group (0- to 5-year-olds) had more boys and was more likely to be admitted to the hospital. The child was injured due to a fall from the horse in 75.7%, bucked/thrown off/kicked off in 17.0%, with the remaining 7.3% from other mechanisms.
Conclusions: This extensive description of fractures in children due to equestrian injuries can be used to determine the effectiveness of future prevention strategies, such as protective equipment and educational programs. It also gives pediatric trauma and orthopedic surgeons an overall view of the types of fractures which occur in children due to equestrian activities.
Keywords: NEISS; child; demographics; equestrian; fracture; horse; injury.
Conflict of interest statement
The authors declare no conflicts of interest.
Figures
Similar articles
-
The demographics of equestrian-related injuries in the United States: injury patterns, orthopedic specific injuries, and avenues for injury prevention.J Trauma. 2008 Aug;65(2):447-60. doi: 10.1097/TA.0b013e31817dac43. J Trauma. 2008. PMID: 18695484
-
Fractures from trampolines: results from a national database, 2002 to 2011.J Pediatr Orthop. 2014 Oct-Nov;34(7):683-90. doi: 10.1097/BPO.0000000000000189. J Pediatr Orthop. 2014. PMID: 24686299
-
All-terrain vehicle use related fracture rates, patterns, and associations from 2002 to 2015 in the USA.Injury. 2019 Feb;50(2):324-331. doi: 10.1016/j.injury.2018.12.005. Epub 2018 Dec 11. Injury. 2019. PMID: 30558806
-
[Complex injury of the elbow joint].Unfallchirurg. 1996 Feb;99(2):92-99. Unfallchirurg. 1996. PMID: 8881223 Review. German.
-
Equestrian injuries.Med Sport Sci. 2005;48:8-17. doi: 10.1159/000084280. Med Sport Sci. 2005. PMID: 16247251 Review.
Cited by
-
Spinal Injuries from Equestrian Activity: A US Nationwide Study.J Clin Med. 2025 Jun 26;14(13):4521. doi: 10.3390/jcm14134521. J Clin Med. 2025. PMID: 40648895 Free PMC article.
References
-
- Schraer K. How Much Does a Horse Weigh? PetMD by Chewy. 2022. [(accessed on 19 July 2024)]. Available online: https://www.petmd.com/horse/how-much-does-horse-weigh.
LinkOut - more resources
Full Text Sources
