

Sensitivity of Acoustic Voice Quality Measures in Simulated Reverberation Conditions
- PMID: 39768071
- PMCID: PMC11673399
- DOI: 10.3390/bioengineering11121253
Sensitivity of Acoustic Voice Quality Measures in Simulated Reverberation Conditions
Abstract
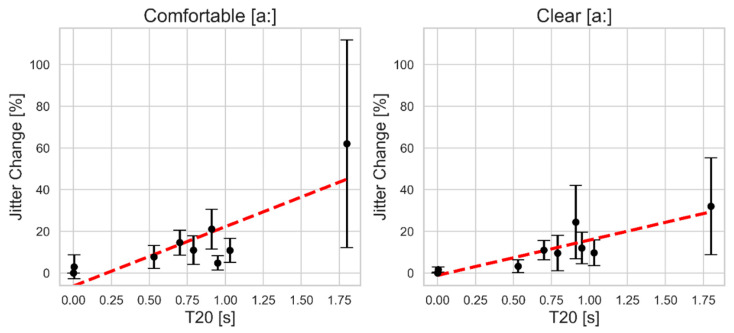
Room reverberation can affect oral/aural communication and is especially critical in computer analysis of voice. High levels of reverberation can distort voice recordings, impacting the accuracy of quantifying voice production quality and vocal health evaluations. This study quantifies the impact of additive simulated reverberation on otherwise clean voice recordings as reflected in voice metrics commonly used for voice quality evaluation. From a larger database of voice recordings collected in a low-noise, low-reverberation environment, voice samples of a sustained [a:] vowel produced at two different speaker intents (comfortable and clear) by five healthy voice college-age female native English speakers were used. Using the reverb effect in Audacity, eight reverberation situations indicating a range of reverberation times (T20 between 0.004 and 1.82 s) were simulated and convolved with the original recordings. All voice samples, both original and reverberation-affected, were analyzed using freely available PRAAT software (version 6.0.13) to calculate five common voice parameters: jitter, shimmer, harmonic-to-noise ratio (HNR), alpha ratio, and smoothed cepstral peak prominence (CPPs). Statistical analyses assessed the sensitivity and variations in voice metrics to a range of simulated room reverberation conditions. Results showed that jitter, HNR, and alpha ratio were stable at simulated reverberation times below T20 of 1 s, with HNR and jitter more stable in the clear vocal style. Shimmer was highly sensitive even at T20 of 0.53 s, which would reflect a common room, while CPPs remained stable across all simulated reverberation conditions. Understanding the sensitivity and stability of these voice metrics to a range of room acoustics effects allows for targeted use of certain metrics even in less controlled environments, enabling selective application of stable measures like CPPs and cautious interpretation of shimmer, ensuring more reliable and accurate voice assessments.
Keywords: reverberation; sensitivity; simulated room acoustics; speech acoustics; voice metrics.
Conflict of interest statement
The authors confirm that there are no conflicts of interest regarding the work introduced in the present paper.
Figures


References
-
- Yousef A.M. Ph.D. Dissertation. Michigan State University; East Lansing, MI, USA: 2023. Laryngeal Mechanisms and Vocal Folds Function in Adductor Laryngeal Dystonia During Connected Speech.
Grants and funding
LinkOut - more resources
Full Text Sources
