. 2024 Dec 17;13(24):2084.
doi: 10.3390/cells13242084.

Second-Generation Antipsychotics Induce Metabolic Disruption in Adipose Tissue-Derived Mesenchymal Stem Cells Through an aPKC-Dependent Pathway

Affiliations

Second-Generation Antipsychotics Induce Metabolic Disruption in Adipose Tissue-Derived Mesenchymal Stem Cells Through an aPKC-Dependent Pathway

Marco Varalda et al. Cells. .

Abstract

Metabolic syndrome (MetS) is a cluster of metabolic abnormalities, including visceral obesity, dyslipidemia, and insulin resistance. In this regard, visceral white adipose tissue (vWAT) plays a critical role, influencing energy metabolism, immunomodulation, and oxidative stress. Adipose-derived stem cells (ADSCs) are key players in these processes within vWAT. While second-generation antipsychotics (SGAs) have significantly improved treatments for mental health disorders, their chronic use is associated with an increased risk of MetS. In this study, we explored the impact of SGAs on ADSCs to better understand their role in MetS and identify potential therapeutic targets. Our findings reveal that olanzapine disrupts lipid droplet formation during adipogenic differentiation, impairing insulin receptor endocytosis, turnover, and signaling. SGAs also alter the endolysosomal compartment, leading to acidic vesicle accumulation and increased lysosomal biogenesis through TFEB activation. PKCζ is crucial for the SGA-induced nuclear translocation of TFEB and acidic vesicle formation. Notably, inhibiting PKCζ restored insulin receptor tyrosine phosphorylation, normalized receptor turnover, and improved downstream signaling following olanzapine treatment. This activation of PKCζ by olanzapine is driven by increased phosphatidic acid synthesis via phospholipase D (PLD), following G protein-coupled receptor (GPCR) signaling activation. Overall, olanzapine and clozapine disrupt endolysosomal homeostasis and insulin signaling in a PKCζ-dependent manner. These findings highlight SGAs as valuable tools for uncovering cellular dysfunction in vWAT during MetS and may guide the development of new therapeutic strategies to mitigate the metabolic side effects of these drugs.

Keywords: PKCζ; adipose tissue; adipose-derived mesenchymal stem cells; endocytosis; insulin resistance; insulin signaling; lysosomes; second-generation antipsychotics.


Conflict of interest statement

The authors declare no conflicts of interest. The funders had no role in the design of the study; in the collection, analyses, or interpretation of data; in the writing of the manuscript, or in the decision to publish the results.

Figures

Figure 1
Figure 1
Assessment of olanzapine and clozapine cytotoxic activity in ADSCs. Viabilities of ADSCs treated with scalar doses of drugs for 72 h; IC50, i.e., we calculated the drug concentration reduced by 50% in terms of viability compared to the control (a). Bar graphs showing cell viability after 7 days of treatment with scalar doses of drugs; viability data are presented as the percentage of viable cells relative to the negative control treated with DMSO. Data are presented as mean ± SEM from three independent experiments (b). **, Student’s t-test p < 0.01; ***, Student’s t-test p < 0.001; ****, Student’s t-test p < 0.001.
Figure 1
Figure 1
Assessment of olanzapine and clozapine cytotoxic activity in ADSCs. Viabilities of ADSCs treated with scalar doses of drugs for 72 h; IC50, i.e., we calculated the drug concentration reduced by 50% in terms of viability compared to the control (a). Bar graphs showing cell viability after 7 days of treatment with scalar doses of drugs; viability data are presented as the percentage of viable cells relative to the negative control treated with DMSO. Data are presented as mean ± SEM from three independent experiments (b). **, Student’s t-test p < 0.01; ***, Student’s t-test p < 0.001; ****, Student’s t-test p < 0.001.
Figure 2
Figure 2
Olanzapine affects ADSC adipogenic differentiation. Representative images of lipid droplets in ADSC#3 treated with 5 μM olanzapine alone or in combination with WAT-differentiating medium using HCS LipidTox for neutral lipids; nuclei were stained using Hoechst 33342 (a). Bar graphs showing quantification of lipid droplet staining/blue nuclei staining ratio as fold change relative to control in ADSC#3 (b) and ADSC#5 (c); data are expressed as the mean ± SD of a representative experiment out of three independent experiments performed in triplicate. Graphs showing quantification of mean dimension and number of lipid droplets in ADSCs treated with olanzapine and in controls (dg); data are expressed as the mean ± SD of a representative experiment out of three independent experiments. *, Student’s t-test p < 0.05. **, Student’s t-test p < 0.01 ***, Student’s t-test p < 0.001. ****, Student’s t-test p < 0.0001.
Figure 3
Figure 3
Olanzapine downregulates insulin signaling. Representative Western blot of ADSC#3 cells after 16-h pretreatment with 5 μM olanzapine and stimulation with insulin (50 ng/mL) for 5, 30, and 60 min; lysates were analyzed for P-INSRβ Y1146, INSRβ, P-AKT T308, P-AKT S473, total AKT, P-ERK T202/Y204, and ERK (a). Bar graphs showing quantification of P-INSRβ Y1142 (b), P-AKT T308 (c), P-AKT S473 (d), and P-ERK T202/Y204 (e) normalized on their respective total proteins and expressed as fold change relative to control. Western blot analysis of immunoprecipitated INSRβ P-Ser in cells stimulated with insulin 50 ng/mL for 15 min (f). Bar graph showing quantification of P-Ser signals normalized on total INSR; densitometry expressed as fold change relative to control (g). Graphs are expressed as the mean ± SD of three independent experiments. *, Student’s t-test p < 0.05; **, Student’s t-test p < 0.01.
Figure 4
Figure 4
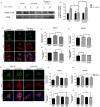
Olanzapine impairs INSR endocytosis. Western blot analysis showing internalization of biotinylated INSRβ in ADSC#5 treated for 16 h with olanzapine and stimulated with insulin for 15 min: Ts represents total biotinylated proteins on the surface, T0 the surface proteins after quenching of the membrane in unstimulated cells, and T15 the surface proteins after endocytosis (a). Bar graph representative of 3 independent experiments showing quantification of internalized receptor; densitometry is expressed as T15 /Ts ratio normalized on total INSRβ, as fold change relative to control (b). Representative images of INSRβ localization on ADSC#5 plasma membrane after 16 h olanzapine treatment and 15 min insulin stimulation; INSRβ was stained using anti-INSRβ primary antibody and secondary Alexa Fluor 488 (green), while actin was stained using phalloidin 546 (c). Bar graphs showing colocalization of INSRβ and actin on ADSC#3 (d) and ADSC#5 (e) plasma membrane expressed as Pearson coefficient; data are expressed as the mean ± SD of 3 independent experiments. Representative images of INSRβ intracellular localization in ADSC#5 treated with olanzapine and in control cells. INSRβ intracellular localization in RAB7-positive late endosomes after 16 h olanzapine treatment and 15 min insulin stimulation; INSRβ was stained using anti-INSRβ primary antibody and secondary Alexa Fluor 488 (green); RAB7 using anti-RAB7 primary antibody and secondary Alexa Fluor 546 (red) (f). Bar graph showing colocalization of INSRβ and RAB7 expressed as Pearson coefficient (g). Representative images of INSRβ localization in CD 63-positive exocytic vesicles after 16 h olanzapine treatment and 15 min insulin stimulation; INSRβ was stained using anti-INSRβ primary antibody and secondary Alexa Fluor 488 (green); CD63 using anti-CD63 primary antibody and secondary Alexa Fluor 546 (red) (h). Bar graph showing colocalization of INSRβ and CD63 expressed as Pearson coefficient (i). Representative images of INSR localization in lysosomes after 16 h olanzapine treatment and 15 min insulin stimulation. INSRβ was stained using anti-INSRβ primary antibody and secondary Alexa Fluor 488 (green); LAMP1 using anti-LAMP1 primary antibody and secondary Alexa Fluor 546 (red) (j). Bar graph showing colocalization of INSRβ and LAMP1 expressed as Pearson coefficient (k). Results are expressed as the mean ± SD of three independent experiments. White boxes indicates zoom area, white arrows indicates colocalization spots. *, Student’s t-test p < 0.05; **, Student’s t-test p < 0.01; ****, Student’s t-test p < 0.0001.
Figure 4
Figure 4
Olanzapine impairs INSR endocytosis. Western blot analysis showing internalization of biotinylated INSRβ in ADSC#5 treated for 16 h with olanzapine and stimulated with insulin for 15 min: Ts represents total biotinylated proteins on the surface, T0 the surface proteins after quenching of the membrane in unstimulated cells, and T15 the surface proteins after endocytosis (a). Bar graph representative of 3 independent experiments showing quantification of internalized receptor; densitometry is expressed as T15 /Ts ratio normalized on total INSRβ, as fold change relative to control (b). Representative images of INSRβ localization on ADSC#5 plasma membrane after 16 h olanzapine treatment and 15 min insulin stimulation; INSRβ was stained using anti-INSRβ primary antibody and secondary Alexa Fluor 488 (green), while actin was stained using phalloidin 546 (c). Bar graphs showing colocalization of INSRβ and actin on ADSC#3 (d) and ADSC#5 (e) plasma membrane expressed as Pearson coefficient; data are expressed as the mean ± SD of 3 independent experiments. Representative images of INSRβ intracellular localization in ADSC#5 treated with olanzapine and in control cells. INSRβ intracellular localization in RAB7-positive late endosomes after 16 h olanzapine treatment and 15 min insulin stimulation; INSRβ was stained using anti-INSRβ primary antibody and secondary Alexa Fluor 488 (green); RAB7 using anti-RAB7 primary antibody and secondary Alexa Fluor 546 (red) (f). Bar graph showing colocalization of INSRβ and RAB7 expressed as Pearson coefficient (g). Representative images of INSRβ localization in CD 63-positive exocytic vesicles after 16 h olanzapine treatment and 15 min insulin stimulation; INSRβ was stained using anti-INSRβ primary antibody and secondary Alexa Fluor 488 (green); CD63 using anti-CD63 primary antibody and secondary Alexa Fluor 546 (red) (h). Bar graph showing colocalization of INSRβ and CD63 expressed as Pearson coefficient (i). Representative images of INSR localization in lysosomes after 16 h olanzapine treatment and 15 min insulin stimulation. INSRβ was stained using anti-INSRβ primary antibody and secondary Alexa Fluor 488 (green); LAMP1 using anti-LAMP1 primary antibody and secondary Alexa Fluor 546 (red) (j). Bar graph showing colocalization of INSRβ and LAMP1 expressed as Pearson coefficient (k). Results are expressed as the mean ± SD of three independent experiments. White boxes indicates zoom area, white arrows indicates colocalization spots. *, Student’s t-test p < 0.05; **, Student’s t-test p < 0.01; ****, Student’s t-test p < 0.0001.
Figure 5
Figure 5
Olanzapine and clozapine induce expansion of intracellular acidic compartments and lysosomal biogenesis. Effects of olanzapine and clozapine on intracellular acidic compartments were evaluated by Lysotracker red staining and fluorescence microscopy after 24 h, 72 h, and 7 days of treatment. Nuclei were stained using Hoechst 33342. Representative images of ADSC#3 treated with vehicle (DMSO, negative control), 5 µM olanzapine, or clozapine at different time points (a). Graphs showing quantification of red Lysotracker staining/blue nuclei staining ratio as fold change relative to control; data are expressed as the mean ± SD of a representative experiment out of three independent experiments performed in triplicate (b,c). Representative image of WB analysis of ADSC#3 after 16 h treatment with SGAs; lysates were analyzed for LC3B, P62, and GAPDH (d). Bar graph showing quantification of the LC3B II/I ratio in ADSC#3 upon chloroquine treatment; densitometric analyses are expressed as the mean ± SD of three independent experiments performed in triplicate (e). Colocalization between LC3B (green) and LAMP1 (red) evaluated in ADSC#3 using confocal microscopy after 16 h treatment with vehicle, olanzapine, or clozapine (f). Histogram showing colocalization LAMP1/LC3B in ADSC#3 expressed as Pearson coefficient (g). Evaluation of intracellular acidic compartments, using Lysotracker red staining, in ADSC#3 cells after 16-h treatment with SGAs alone or in combination with 3-methyladenine (h). Bar graph showing acidic vesicle accumulation in ADSC#3 (i)) and ADSC#5 (j) treated for 16 h with olanzapine and 5 μM clozapine alone or in association with 3-methyladenine (3-MA); data are expressed as quantification of red Lysotracker staining/blue nuclei staining ratio as fold change relative to negative control. *, Student’s t-test p < 0.05; **, Student’s t-test p < 0.01; ***, Student’s t-test p < 0.001; ****, p < 0.0001.
Figure 5
Figure 5
Olanzapine and clozapine induce expansion of intracellular acidic compartments and lysosomal biogenesis. Effects of olanzapine and clozapine on intracellular acidic compartments were evaluated by Lysotracker red staining and fluorescence microscopy after 24 h, 72 h, and 7 days of treatment. Nuclei were stained using Hoechst 33342. Representative images of ADSC#3 treated with vehicle (DMSO, negative control), 5 µM olanzapine, or clozapine at different time points (a). Graphs showing quantification of red Lysotracker staining/blue nuclei staining ratio as fold change relative to control; data are expressed as the mean ± SD of a representative experiment out of three independent experiments performed in triplicate (b,c). Representative image of WB analysis of ADSC#3 after 16 h treatment with SGAs; lysates were analyzed for LC3B, P62, and GAPDH (d). Bar graph showing quantification of the LC3B II/I ratio in ADSC#3 upon chloroquine treatment; densitometric analyses are expressed as the mean ± SD of three independent experiments performed in triplicate (e). Colocalization between LC3B (green) and LAMP1 (red) evaluated in ADSC#3 using confocal microscopy after 16 h treatment with vehicle, olanzapine, or clozapine (f). Histogram showing colocalization LAMP1/LC3B in ADSC#3 expressed as Pearson coefficient (g). Evaluation of intracellular acidic compartments, using Lysotracker red staining, in ADSC#3 cells after 16-h treatment with SGAs alone or in combination with 3-methyladenine (h). Bar graph showing acidic vesicle accumulation in ADSC#3 (i)) and ADSC#5 (j) treated for 16 h with olanzapine and 5 μM clozapine alone or in association with 3-methyladenine (3-MA); data are expressed as quantification of red Lysotracker staining/blue nuclei staining ratio as fold change relative to negative control. *, Student’s t-test p < 0.05; **, Student’s t-test p < 0.01; ***, Student’s t-test p < 0.001; ****, p < 0.0001.
Figure 6
Figure 6
TFEB nuclear localization was investigated using confocal microscopy in ADSC#3 treated for 16 h with a vehicle or olanzapine. TFEB was stained using an anti-TFEB primary antibody and a secondary Alexa Fluor 488 (green), nuclei were stained using DAPI, and actin was stained using phalloidin 546 (a). Bar graph showing quantification of TFEB nuclear localization expressed as TFEB mean fluorescence in nuclear area normalized as fold change relative to control of three independent experiments (b). Representative images of WB analysis of ADSC#3 after 16-h treatment with olanzapine; lysates were analyzed for cathepsin B and GAPDH (c). Bar graph showing quantification of cathepsin B expression normalized on GAPDH. Densitometric analysis is expressed as the mean ± SD of three independent experiments (d). Evaluation of intracellular acidic compartments, using Lysotracker red staining, in ADSC#3 cells after 16-h treatment with SGAs alone or in combination with CHX (e). Bar graph showing acidic vesicle accumulation in cells treated for 16 h with olanzapine (5 µM) and clozapine (5 µM) alone or in the presence of CHX; data are expressed as quantification of red Lysotracker staining/blue nuclei staining ratio as fold change relative to negative control (f,g). **, Student’s t-test p < 0.01; ***, Student’s t-test p < 0.001, Student’s t-test ****, p < 0.0001.
Figure 7
Figure 7
PKCζ-dependent expansion of acidic vesicles mediated by SGAs. Western blot analysis of ADSCs treated with 5 μM SGAs for 16 h. Lysates were analyzed for P-(Ser)-PKC substrate, P-PKCζ T560, total PKCζ, and tubulin (a). Confocal microscopy experiments showing P-PKCζ T560 localization in ADSC#3 treated with 5 μM olanzapine for 16 h (b). Bar graph showing quantification of P-PKCζ T560 normalized to cell area; data are expressed as the mean ± SD of three independent experiments (c,d). Evaluation of intracellular acidic compartments, based on Lysotracker red staining, in ADSC#3 cells after 16-h treatment with SGAs alone or in combination with Go6850 or PKCζ inhibitory pseudosubstrate (PS-PKCζ); nuclei were stained using Hoechst 33342 (e). Bar graph showing acidic vesicle quantification in cells treated for 16 h with olanzapine (5 μM) or clozapine (5 μM) alone, or in combination with Go6850 or PS-PKCζ; data are expressed as quantification of red Lysotracker staining/blue nuclei staining ratio as fold change relative to negative control and expressed as the mean ± SD of a representative experiment out of three independent experiments performed in triplicate (f). Representative images showing acidic vesicle accumulation in ADSC#3 transfected with SiRNA NT and SiRNA PKCζ and treated with olanzapine or clozapine for 16 h; nuclei were stained using Hoechst 33342 (g). Bar graph showing acidic vesicle quantification in ADSC#3 cells silenced for PKCζ and treated for 16 h with olanzapine or clozapine; data are expressed as quantification of red Lysotracker staining/blue nuclei staining ratio as fold change relative to negative control and expressed as the mean ± SD of a representative experiment out of three independent experiments performed in triplicate (h). Representative images of confocal microscopy analysis of TFEB localization using anti-TFEB primary antibody and Alexa Fluor 488 secondary antibody in ADSC#3 treated with olanzapine alone or in combination with PS-PKCζ (i). Bar graph showing quantification of TFEB nuclear localization expressed as TFEB mean fluorescence in nuclear area normalized as fold change relative to control of three independent experiments (j). ****, Student’s t-test p < 0.0001; ***, Student’s t-test p < 0.001.
Figure 7
Figure 7
PKCζ-dependent expansion of acidic vesicles mediated by SGAs. Western blot analysis of ADSCs treated with 5 μM SGAs for 16 h. Lysates were analyzed for P-(Ser)-PKC substrate, P-PKCζ T560, total PKCζ, and tubulin (a). Confocal microscopy experiments showing P-PKCζ T560 localization in ADSC#3 treated with 5 μM olanzapine for 16 h (b). Bar graph showing quantification of P-PKCζ T560 normalized to cell area; data are expressed as the mean ± SD of three independent experiments (c,d). Evaluation of intracellular acidic compartments, based on Lysotracker red staining, in ADSC#3 cells after 16-h treatment with SGAs alone or in combination with Go6850 or PKCζ inhibitory pseudosubstrate (PS-PKCζ); nuclei were stained using Hoechst 33342 (e). Bar graph showing acidic vesicle quantification in cells treated for 16 h with olanzapine (5 μM) or clozapine (5 μM) alone, or in combination with Go6850 or PS-PKCζ; data are expressed as quantification of red Lysotracker staining/blue nuclei staining ratio as fold change relative to negative control and expressed as the mean ± SD of a representative experiment out of three independent experiments performed in triplicate (f). Representative images showing acidic vesicle accumulation in ADSC#3 transfected with SiRNA NT and SiRNA PKCζ and treated with olanzapine or clozapine for 16 h; nuclei were stained using Hoechst 33342 (g). Bar graph showing acidic vesicle quantification in ADSC#3 cells silenced for PKCζ and treated for 16 h with olanzapine or clozapine; data are expressed as quantification of red Lysotracker staining/blue nuclei staining ratio as fold change relative to negative control and expressed as the mean ± SD of a representative experiment out of three independent experiments performed in triplicate (h). Representative images of confocal microscopy analysis of TFEB localization using anti-TFEB primary antibody and Alexa Fluor 488 secondary antibody in ADSC#3 treated with olanzapine alone or in combination with PS-PKCζ (i). Bar graph showing quantification of TFEB nuclear localization expressed as TFEB mean fluorescence in nuclear area normalized as fold change relative to control of three independent experiments (j). ****, Student’s t-test p < 0.0001; ***, Student’s t-test p < 0.001.
Figure 8
Figure 8
Olanzapine-induced metabolic alterations in ADSCs are PKCζ-dependent. Representative Western blot of ADSC#3 cells after 16 h of pretreatment with 5 µM olanzapine, either alone or in the presence of PS-PKCζ, followed by insulin stimulation (50 ng/mL) for 30 min. Lysates were analyzed for P-INSRβ Y1146 and total INSRβ (a). The bar graph shows the quantification of P-INSRβ Y1146 normalized to total INSRβ, expressed as fold change relative to control; data are presented as mean ± SD from three independent experiments (b). Representative images of ADSC#3 stimulated with insulin (50 ng/mL) following 16-h treatment with 5 μM olanzapine alone or in combination with PKCζ inhibitory pseudosubstrate showing INSRβ localization on the plasma membrane and in late endosomes; INSRβ was stained using anti-INSRβ primary antibody and secondary Alexa Fluor 546 (red); RAB7 was stained using anti-RAB7 primary antibody and secondary Alexa Fluor 488 (green); and actin was stained using phalloidin 633 (c). Bar graph showing colocalization of INSRβ and actin (d) or RAB7 (e) in ADSC#3 expressed as Pearson coefficient; data are expressed as the mean ± SD of three independent experiments. Bar graph showing colocalization of INSRβ and actin or RAB7 in ADSC#5 expressed as Pearson coefficient; data are expressed as the mean ± SD of three independent experiments (f,g). Representative images of ADSC#3 transfected with siRNA-targeting PKCζ and stimulated with insulin (50 ng/mL) after 16 h of treatment with 5 μM olanzapine. The images show INSRβ localization on the plasma membrane and within late endosomes; INSRβ was stained using anti-INSRβ primary antibody and secondary Alexa Fluor 546 (red); RAB7 was stained using anti-RAB7 primary antibody and secondary Alexa Fluor 488 (green); and actin was stained using phalloidin 633 (h). Bar graph showing colocalization of INSRβ and actin on plasma membrane expressed as Pearson coefficient in ADSC#3 and #5; data are expressed as the mean ± SD of three independent experiments (i,k). Bar graph showing quantification of colocalization of INSRβ with late endosome marker RAB7 expressed as Pearson coefficient in ADSC#3 and #5; results are expressed as the mean ± SD of three independent experiments (j,l). White arrows indicates colocalization spots. *, Student’s t-test p < 0.05; ***, Student’s t-test p < 0.001; ****, Student’s t-test p < 0.0001.
Figure 9
Figure 9
Olanzapine activates PKCζ by modulating GPCR signaling. PA accumulation was analyzed in 3T3L1 cells transfected with Pii-PA (PA indicator with superior sensitivity) DOCK2 (DOCK2-Pii) [34] after 16 h treatment with olanzapine alone or in combination with PLD inhibitor FIPI, EPAC inhibitor CE3F4, and Gq/11 inhibitor YM254890. Representative images of transfected cells treated with DMSO, negative control, 5 μM olanzapine alone or in combination with 750 nM FIPI. Arrows point to dots representing PA accumulation (a). Bar graph quantification of green dots normalized on cell area and expressed as fold change relative to control; results are expressed as the mean ± SD of three independent experiments (b). Bar graphs showing acidic vesicle accumulation in ADSC#3 (c) and ADSC#5 (d) treated for 16 h with olanzapine or clozapine (5 μM) alone or in combination with 750 nM Fipi, 10 μM EPAC inhibitor, 10 μM SQ22, 10 μM Suramin, or 10 μM YM254890; data are expressed as quantification of red Lysotracker staining/blue nuclei staining ratio as fold change relative to negative control and are expressed as the mean ± SD of a representative experiment out of three independent experiments performed in triplicate. Confocal microscopy assessment of P-PKCζ T560 expression in cells treated with 5 μM olanzapine/vehicle alone or in combination with 750 nM Fipi or 10 μM YM254890 for 16 h; phosphorylated PKC was evaluated using P-PKCζ T560 primary antibody and Alexa Fluor 546 secondary antibody, while actin was stained using Phalloidin 633 (e). Bar graph showing quantification of P-PKCζ T560 normalized to cell area; data are expressed as mean ± SD from three independent experiments (f). ** p < 0.01; *** p < 0.001; **** p < 0.0001 (Student’s t-test).
Figure 10
Figure 10
Proposed mechanism of olanzapine-induced metabolic disruption. Olanzapine’s effects are mediated by Gαq and Gαs, initiating signaling cascades that activate phospholipase D and PKCζ. PKCζ disrupts insulin signaling and impairs INSR turnover. Through PP2A activation, this leads to TFEB dephosphorylation and nuclear translocation, promoting lysosomal biogenesis. The combined effects of lysosomal accumulation and PKCζ-induced disruption of INSR phosphorylation further impair insulin signaling and INSR turnover. Image created in https://BioRender.com (accessed on 30 October 2024).

References

    1. Rochlani Y., Pothineni N.V., Kovelamudi S., Mehta J.L. Metabolic Syndrome: Pathophysiology, Management, and Modulation by Natural Compounds. Ther. Adv. Cardiovasc. Dis. 2017;11:215–225. doi: 10.1177/1753944717711379. - DOI - PMC - PubMed
    1. WHO . WHO Ageing and Health. WHO; Geneve, Switzerland: 2018.
    1. Frasca D., Blomberg B.B., Paganelli R. Aging, Obesity, and Inflammatory Age-Related Diseases. Front. Immunol. 2017;8:1745. doi: 10.3389/fimmu.2017.01745. - DOI - PMC - PubMed
    1. Regufe V.M.G., Pinto C.M.C.B., Perez P.M.V.H.C. Metabolic Syndrome in Type 2 Diabetic Patients: A Review of Current Evidence. Porto Biomed. J. 2020;5:e101. doi: 10.1097/j.pbj.0000000000000101. - DOI - PMC - PubMed
    1. Zwick R.K., Guerrero-Juarez C.F., Horsley V., Plikus M.V. Anatomical, Physiological, and Functional Diversity of Adipose Tissue. Cell Metab. 2018;27:68–83. doi: 10.1016/j.cmet.2017.12.002. - DOI - PMC - PubMed

Publication types

MeSH terms

LinkOut - more resources