. 2024 Dec 10;25(24):13242.
doi: 10.3390/ijms252413242.

Altered Cellular Metabolism Is a Consequence of Loss of the Ataxia-Linked Protein Sacsin

Affiliations

Altered Cellular Metabolism Is a Consequence of Loss of the Ataxia-Linked Protein Sacsin

Laura Perna et al. Int J Mol Sci. .

Abstract

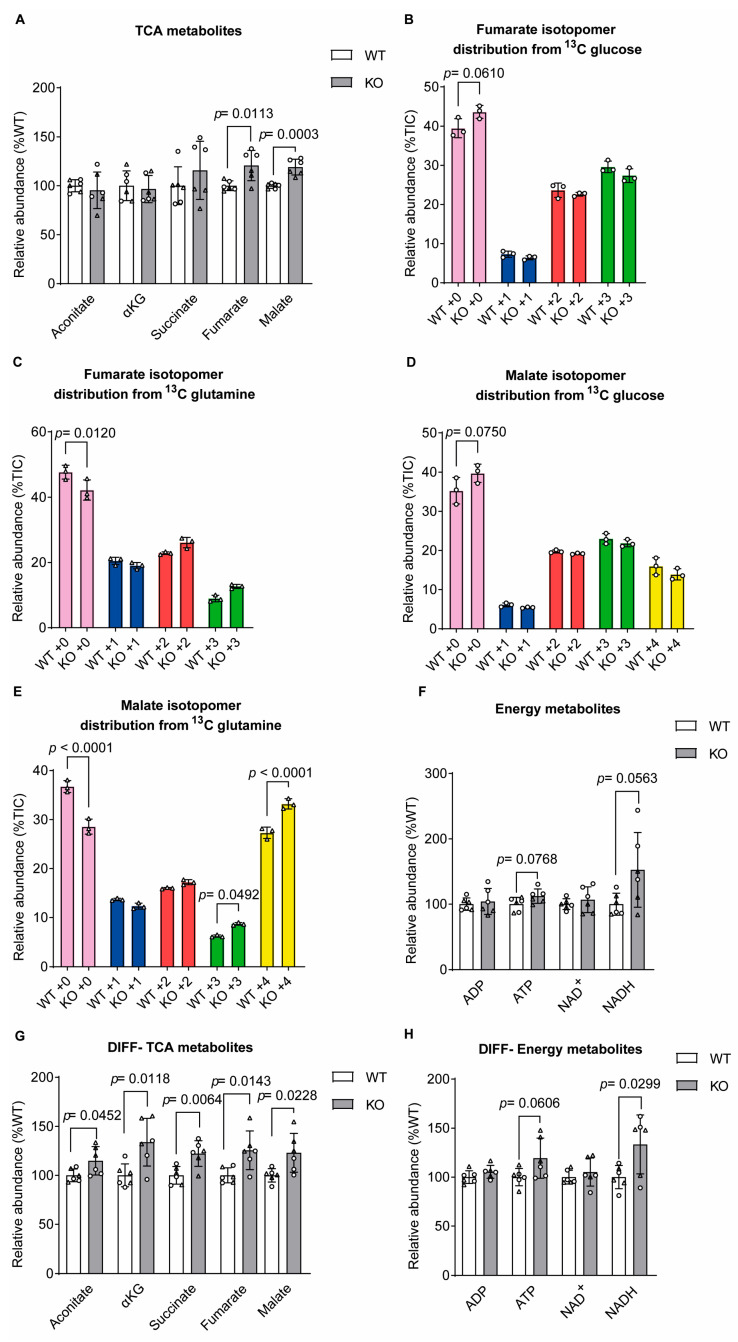
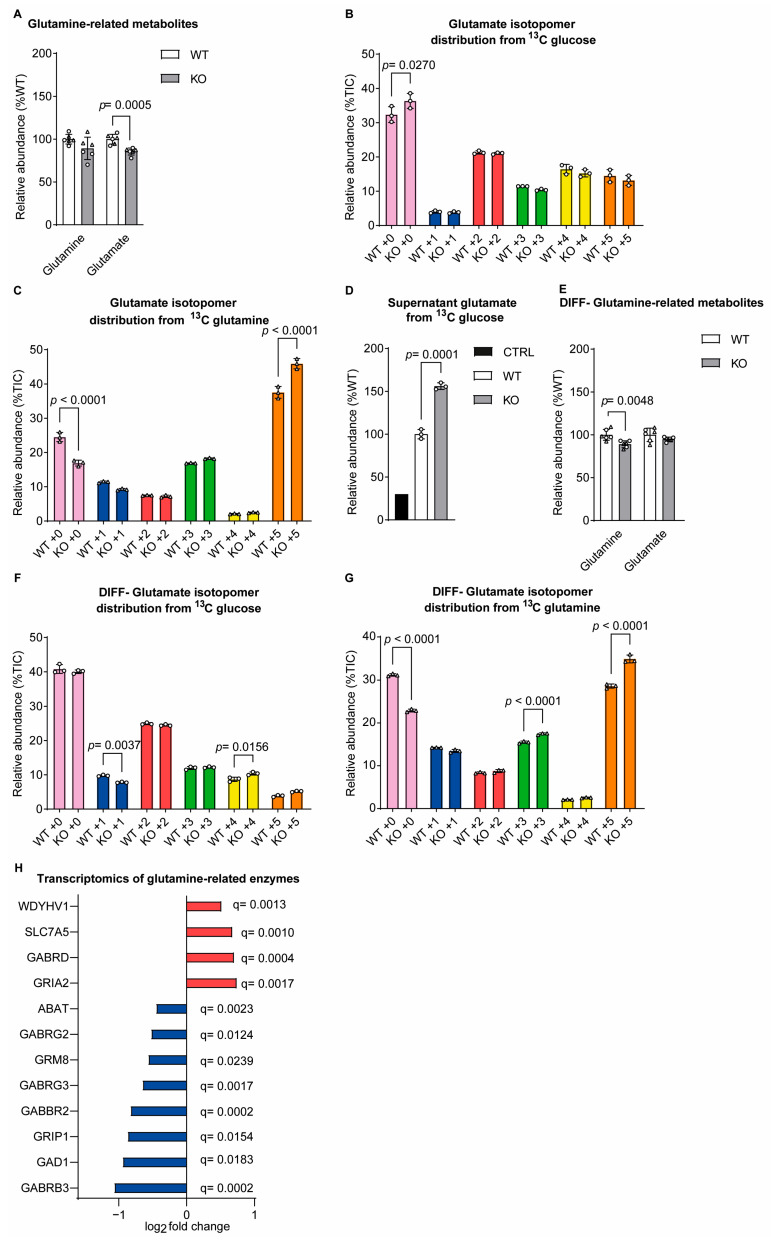
Mitochondrial dysfunction is implicated in the pathogenesis of the neurological condition autosomal recessive spastic ataxia of Charlevoix-Saguenay (ARSACS), yet precisely how the mitochondrial metabolism is affected is unknown. Thus, to better understand changes in the mitochondrial metabolism caused by loss of the sacsin protein (encoded by the SACS gene, which is mutated in ARSACS), we performed mass spectrometry-based tracer analysis, with both glucose- and glutamine-traced carbon. Comparing the metabolite profiles between wild-type and sacsin-knockout cell lines revealed increased reliance on aerobic glycolysis in sacsin-deficient cells, as evidenced by the increase in lactate and reduction of glucose. Moreover, sacsin knockout cells differentiated towards a neuronal phenotype had increased levels of tricarboxylic acid cycle metabolites relative to the controls. We also observed disruption in the glutaminolysis pathway in differentiated and undifferentiated cells in the absence of sacsin. In conclusion, this work demonstrates consequences for cellular metabolism associated with a loss of sacsin, which may be relevant to ARSACS.

Keywords: ARSACS; aerobic glycolysis; metabolism; mitochondria; sacsin.


Conflict of interest statement

The authors declare no conflicts of interest.

Figures

Figure 1
Figure 1
Sacsin knockout cells exhibit increased lactate production. (A) Schematic representation of [U-13C] glucose tracer labelling of cellular metabolites. The six carbons of glucose are represented in different colours, and in each round of glycolysis, three of these carbons are converted into pyruvate and then incorporated into other metabolites. (B) Levels of glycolysis metabolites from both glucose and glutamine labelling in SH-SY5Y cells. (C) Percentage of lactate isotopomers distribution from [U-13C]-traced glucose of the cells. (D,E) Cell confluency was assessed for both wild-type control and sacsin knockout cells in vehicle-treated media and in media supplemented with sodium oxamate (D), in untreated media and glucose-free media (E) over 3 days. Cell confluency quantification was performed with Incucyte S3 software analysis. Two-way ANOVA with Tukey’s multiple comparison test was applied, n = 3. (F,G) Levels of (F) glucose and (G) lactate in cell culture media collected after 16 h. An additional control sample was added containing only the medium and processed as a regular sample. (H) Levels of glycolysis metabolites from both glucose and glutamine labelling in differentiated SH-SY5Y cells. (I) Levels of lactate in differentiated spent medium of SH-SY5Y cells. Levels of each isotopomer are expressed as a percentage of the total. The significance level was 0.05 (test used Anderson–Darling). The raw value, for the peak areas of the metabolites of interest, has been normalised to the total ion count (TIC), which is the sum of every metabolite found in the samples. Total metabolites (BI) unpaired t-test, isotopomers distribution (C) one-way ANOVA. All error bars are S.D. ○ = traced glucose, ∆ = traced glutamine, KG = ketoglutarate, TCA = tricarboxylic acid cycle, CoA = coenzyme A, PEP = phosphoenolpyruvate, WT = wild-type control, KO = sacsin knockout, CTRL = media control, Undiff = undifferentiated SH-SY5Y and diff = differentiated SH-SY5Y.
Figure 2
Figure 2
Malate levels were increased in sacsin knockout cells. (A) Levels of TCA metabolites in wild-type control and sacsin knockout SH-SY5Y cells from both glucose and glutamine labelling. (B,D) Distribution of fumarate (B) and malate (D) isotopomers arising from [U-13C]-traced glucose after labelling of the control and sacsin knockout cells. (C,E) Distribution of fumarate (C) and malate (E) isotopomers arising from [U-13C]-traced glutamine after labelling of the control and sacsin knockout cells. (F) Total levels of ADP, ATP, NAD+ and NADH in the control and sacsin knockout cells from both glucose and glutamine labelling. (G) Levels of TCA cycle metabolites from both glucose and glutamine labelling in differentiated SH-SY5Y cells. (H) Total levels of ADP, ATP, NAD+ and NADH in differentiated control and sacsin knockout cells from both glucose and glutamine labelling. Levels of each isotopomer are expressed as a percentage of the total. Data are normalised to the total ion count (TIC). Total metabolites (A,FH) unpaired t-test, isotopomers distribution (BE) one-way ANOVA. All error bars are S.D. ○ = traced glucose, ∆ = traced glutamine, KG = ketoglutarate, TCA = tricarboxylic acid cycle, WT = wild-type control, KO = sacsin knockout, Undiff = undifferentiated SH-SY5Y and diff = differentiated SH-SY5Y.
Figure 3
Figure 3
Glutamate levels were decreased in sacsin knockout cells. (A) Levels of glutamine-related metabolites from both glucose and glutamine labelling in SH-SY5Y cells. (B,C) Distribution of glutamate isotopomers arising from (B) [U-13C]-traced glucose or (C) [U-13C]-traced glutamine after labelling of control and sacsin knockout cells. (D) Levels of glutamate in spent medium of [U-13C]-traced glucose. (E) Levels of glutamine-related metabolites from both glucose and glutamine labelling in differentiated SH-SY5Y cells. (F,G) Distribution of glutamate isotopomers arising from (F) [U-13C]-traced glucose or (G) [U-13C]-traced glutamine after labelling of control and sacsin knockout cells. (H) Levels of transcript for enzymes involved in the glutamine-related pathway in sacsin knockout normalised to the controls. Data are for differentially expressed genes (p < 0.05), from the transcriptomics analysis of differentiated SH-SY5Y cells [8]. False discovery rate q values are displayed on the graph. Data are normalised to the total ion count (TIC). total metabolites unpaired t-test. All error bars are the S.D. ○ = traced glucose, ∆ = traced glutamine, WT = wild-type control, KO = sacsin knockout, CTRL = media control, Undiff = undifferentiated SH-SY5Y and diff = differentiated SH-SY5Y.
Figure 4
Figure 4
Isoleucine and leucine levels were increased in the absence of sacsin. (AC) Levels of (A) essential amino acids, (B) amino acids and (C) urea cycle metabolites from both glucose and glutamine labelling in SH-SY5Y cells. (DF) Levels of (D) essential amino acids, (E) amino acids and (F) urea cycle metabolites from both glucose and glutamine labelling in differentiated SH-SY5Y cells. Data are normalised to the total ion count (TIC). total metabolites unpaired t-test. All error bars are the S.D. ○ = traced glucose, ∆ = traced glutamine, diff = differentiated SH-SY5Y, WT = wild-type control, KO = sacsin knockout and N-acasp = n-acetylaspartate.
Figure 5
Figure 5
Summary of the metabolic alteration in the absence of sacsin. Schematic representation of altered metabolites in the absence of sacsin on the left in undifferentiated cell lines, and on the right in differentiated cell lines, using both [U-13C] glucose and [U-13C] glutamine tracer labelling. Red arrows indicate if levels of metabolites are increased or decreased. Black arrows show metabolic pathways.

Similar articles

References

    1. Engert J.C., Bérubé P., Mercier J., Doré C., Lepage P., Ge B., Bouchard J.-P., Mathieu J., Melançon S.B., Schalling M., et al. ARSACS, a spastic ataxia common in northeastern Québec, is caused by mutations in a new gene encoding an 11.5-kb ORF. Nat. Genet. 2000;24:120–125. doi: 10.1038/72769. - DOI - PubMed
    1. Parfitt D.A., Michael G.J., Vermeulen E.G., Prodromou N.V., Webb T.R., Gallo J.-M., Cheetham M.E., Nicoll W.S., Blatch G.L., Chapple J.P. The ataxia protein sacsin is a functional co-chaperone that protects against polyglutamine-expanded ataxin-1. Hum. Mol. Genet. 2009;18:1556–1565. doi: 10.1093/hmg/ddp067. - DOI - PMC - PubMed
    1. Bradshaw T.Y., Romano L.E.L., Duncan E.J., Nethisinghe S., Abeti R., Michael G.J., Giunti P., Vermeer S., Chapple J.P. A reduction in Drp1-mediated fission compromises mitochondrial health in autosomal recessive spastic ataxia of Charlevoix Saguenay. Hum. Mol. Genet. 2016;25:3232–3244. doi: 10.1093/hmg/ddw173. - DOI - PMC - PubMed
    1. Girard M., Larivière R., Parfitt D.A., Deane E.C., Gaudet R., Nossova N., Blondeau F., Prenosil G., Vermeulen E.G.M., Duchen M.R., et al. Mitochondrial dysfunction and Purkinje cell loss in autosomal recessive spastic ataxia of Charlevoix-Saguenay (ARSACS) Proc. Natl. Acad. Sci. USA. 2012;109:1661–1666. doi: 10.1073/pnas.1113166109. - DOI - PMC - PubMed
    1. Morani F., Doccini S., Sirica R., Paterno M., Pezzini F., Ricca I., Simonati A., Delledonne M., Santorelli F.M. Functional Transcriptome Analysis in ARSACS KO Cell Model Reveals a Role of Sacsin in Autophagy. Sci. Rep. 2019;9:11878. doi: 10.1038/s41598-019-48047-x. - DOI - PMC - PubMed

Supplementary concepts

Grants and funding

LinkOut - more resources