. 2024 Dec 10;25(24):13250.
doi: 10.3390/ijms252413250.

Enhancing Clinical Applications by Evaluation of Sensitivity and Specificity in Whole Exome Sequencing

Affiliations

Enhancing Clinical Applications by Evaluation of Sensitivity and Specificity in Whole Exome Sequencing

Youngbeen Moon et al. Int J Mol Sci. .

Abstract

The cost-effectiveness of whole exome sequencing (WES) remains controversial due to variant call variability, necessitating sensitivity and specificity evaluation. WES was performed by three companies (AA, BB, and CC) using reference standards composed of DNA from hydatidiform mole and individual blood at various ratios. Sensitivity was assessed by the detection rate of null-homozygote (N-H) alleles at expected variant allelic fractions, while false positive (FP) errors were counted for unexpected alleles. Sensitivity was approximately 20% for in-house results from BB and CC and around 5% for AA. Dynamic Read Analysis for GENomics (DRAGEN) analyses identified 1.34 to 1.71 times more variants, detecting over 96% of in-house variants, with sensitivity for common variants increasing to 5%. In-house FP errors varied significantly among companies (up to 13.97 times), while DRAGEN minimized this variation. Despite DRAGEN showing higher FP errors for BB and CC, the increased sensitivity highlights the importance of effective bioinformatic conditions. We also assessed the potential effects of target enrichment and proposed optimal cutoff values for the read depth and variant allele fraction in WES. Optimizing bioinformatic analysis based on sensitivity and specificity from reference standards can enhance variant detection and improve the clinical utility of WES.

Keywords: WES; cancer; false negative error; false positive error; mutation; quality control; reference standard.


Conflict of interest statement

The authors declare no conflicts of interest.

Figures
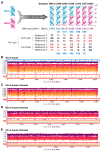
Figure 1
Figure 1
Evaluation of WES sensitivity by estimating false negative (FN) errors in reference standards. (A). Sensitivity determination using WES results from reference-standard DNAs prepared by mixing DNA1 (H. mole DNA) and DNA2 (blood DNA) at various ratios. Two types of N–H pair alleles were analyzed: N–Ho pairs and Ho–N pairs. Variant alleles detected are marked in red. Variants with expected variant allele fractions (eVAFs) ranging from 0.05 to 0.95 are labeled as V5 to V95 (in blue). (B). Observed VAF and FN errors of in-house AA N–H pairs after removing variants on the X or Y chromosome. A significant number of variant alleles with eVAFs of 50% or less displayed VAFs around 1 (blue box). (C). FN errors of in-house AA N–H pairs after trimming. Details for trimming are provided in Materials and Methods. (D). FN errors of in-house BB N–H pairs after trimming. (E). FN errors of in-house CC N–H pairs after trimming. For panels (BE), the FN alleles in the reference standards are highlighted within the red rectangles. The details regarding V5 to V50 are provided in the Materials and Methods section. X-axis: alleles aligned by chromosomal position. Y-axis: observed VAF.
Figure 2
Figure 2
Variant detection rate and the total number of in-house N–H pairs at various eVAFs. A. Variant detection rate of in-house AA results according to read depth cutoffs. B. Variant detection rate of in-house BB results according to read depth cutoffs. C. Variant detection rate of in-house CC results according to read depth cutoffs. In panels (AC), the detection rate (Y-axis) is plotted against expected variant allele frequencies (eVAFs) (X-axis) for various read depth cutoffs ranging from 10 to 50 (DP10 to DP50). (D). Number of detected variants based on read depth cutoffs from 10 to 50 (DP10 to DP50) for the three companies. The X-axis represents read depth cutoffs, while the Y-axis shows the number of detected variants. (E). Variant detection rate based on in-house results across VAF cutoffs ranging from 0 to 0.05. The detection rate (Y-axis) is plotted against eVAFs (X-axis) for different VAF cutoffs, labeled as AA0 to AA0.05. Detection rates for companies BB and CC were consistent across all VAF cutoffs from 0 to 0.05. (F). A Venn diagram illustrating in-house variant calls for companies AA, BB, and CC with a read depth cutoff of 10.
Figure 3
Figure 3
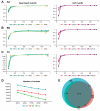
Detection rates of N–H variants analyzed by the DRAGEN system in whole exome sequencing (WES) results from three companies. (A). Detection rate of DRAGEN-analyzed variants for company AA. (B). Detection rate of DRAGEN-analyzed variants for company BB. (C). Detection rate of DRAGEN-analyzed variants for company CC. For panels (AC), the detection rate (Y-axis) is plotted against eVAF values (X-axis). The left column applies read depth cutoffs ranging from 10 to 50 (DP10 to DP50), while the right column employs variant allele frequency (VAF) cutoffs from 0 to 0.05 (VAF0 to VAF0.05). (D). Number of variants detected based on read depth cutoffs (DP10 to DP50). X-axis: the read depth cutoff. Y-axis: the number of detected variants. (E). A Venn diagram illustrating the DRAGEN-analyzed WES results from three companies shows that most N–H variants were shared among them.
Figure 4
Figure 4
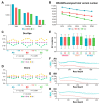
The number and detection rate of variants common to or specific to in-house or DRAGEN analyses. (A). The number of N–H variants analyzed by DRAGEN or in-house methods across various categories, indicating commonality or specificity. Y-axis: read depth. (B). Read depth in combined N–H alleles from DNA1 and DNA2 with a read depth cutoff of 10. Y-axis: read depth expressed as a box plot with 10–90 percentile whiskers. * indicates p < 0.0001. (C). Detection rate of N–H variants in AA results depending on read depth cutoffs from 10 to 50 (DP10 to DP50) across various categories. (D). Detection rate of N–H variants in BB results across various categories. (E). Detection rate of N–H variants in CC results across various categories. In panels (CE), the X-axis represents eVAF and the Y-axis represents the detection rate of variants. For all panels, Dra-C, AA-C, BB-C, CC-C, Dra-Spe, AA-Spe, BB-Spe, and CC-Spe can be found in the Materials and Methods section.
Figure 5
Figure 5
Observed VAF of N–H variants according to expected variant allele frequencies (eVAFs). (A). Observed VAF of in-house-specific N–H variants. (B). VAF of DRAGEN-specific N–H variants. (C). VAF of Dra-C N–H variants. (D). VAF of in-house-C N–H variants. The X-axis represents eVAF, ranging from V5 to V95, for companies AA, BB, and CC. The Y-axis displays VAF as a box plot with 10–90 percentile whiskers.
Figure 6
Figure 6
Characteristics of DRAGEN-analyzed N–H variants from the three companies. (A). The number of identified N–H variants. The Y-axis represents the number of N–H variants. (B). The change in the total number of DRAGEN-analyzed N–H variants according to read depth cutoffs. X-axis: read depth cutoffs from 10 to 50 (DP10 to DP50). Y-axis: the number of identified N–H variants. (C). Variation in VAF for Dra-Spe variants. (D). Variation in VAF for Dra-C variants. In panels (C,D), the Y-axis represents the adjusted VAF values, with the Q2 value adjusted to 0.5, while the differences are applied also to the Q1 and Q3 values. X-axis: variants from V5 to V95. The statistical significance is displayed below the graphs. (E). Comparison of GC content for DRAGEN-analyzed total (DRAGEN), Dra-C, and Dra-Spe variants, using a low read depth cutoff of 10. Y-axis: GC contents (%) as a box plot with 10–90 percentile whiskers. (F). Read depth distributions for DRAGEN-analyzed variants from Company AA. (G). Read depth distributions for DRAGEN-analyzed variants from company BB. (H). Read depth distributions for DRAGEN-analyzed variants from company CC. For panels (FH), the DNA1 sample was analyzed. X-axis: the read depth of variants with the same read depth. Y-axis: the count of variants with the same read depths (in red) alongside the total read depth count (in blue).
Figure 7
Figure 7
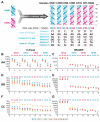
False positive (FP) errors in WES. (A). Determination of FP errors based on the pairs of DNA1 and DNA2: R–R pairs, V–V pairs, and R–V pairs. In this example, there is one FP error among 10 R–R pair alleles, two FP errors among 10 V–V pair alleles, and one FP error in R–V pair alleles, resulting in a total FP error rate of 4. FP errors in R–R pair alleles are shown for companies AA, BB, and CC, analyzed by either in-house or DRAGEN methods. (B). FP errors in R–R pairs from in-house AA variants. (C). FP errors in R–R pairs from DRAGEN-analyzed AA variants. (D). FP errors in R–R pairs from in-house BB variants. (E). FP errors in R–R pairs from DRAGEN-analyzed BB variants. (F). FP errors in R–R pairs from in-house CC variants. (G). FP errors in R–R pairs from DRAGEN-analyzed CC variants. In panels (BG), the X-axis represents various cutoff conditions, and the Y-axis shows the number of FP errors. Samples were indicated as CH5 to CH95. V1 to V5 represent VAF cutoffs of 0, 0.01, 0.03, and 0.05, respectively. Similarly, DPall to DP50 represent read depth cutoffs of 0, 10, 30, and 50, respectively.

Similar articles

References

    1. Goodwin S., McPherson J.D., McCombie W.R. Coming of age: Ten years of next-generation sequencing technologies. Nat. Rev. Genet. 2016;17:333–351. doi: 10.1038/nrg.2016.49. - DOI - PMC - PubMed
    1. Satam H., Joshi K., Mangrolia U., Waghoo S., Zaidi G., Rawool S., Thakare R.P., Banday S., Mishra A.K., Das G., et al. Next-Generation Sequencing Technology: Current Trends and Advancements. Biology. 2023;12:997. doi: 10.3390/biology12070997. - DOI - PMC - PubMed
    1. Shendure J., Balasubramanian S., Church G.M., Gilbert W., Rogers J., Schloss J.A., Waterston R.H. DNA sequencing at 40: Past, present and future. Nature. 2017;550:345–353. doi: 10.1038/nature24286. - DOI - PubMed
    1. Luh F., Yen Y. FDA guidance for next generation sequencing-based testing: Balancing regulation and innovation in precision medicine. NPJ Genom. Med. 2018;3:28. doi: 10.1038/s41525-018-0067-2. - DOI - PMC - PubMed
    1. Xiao W., Ren L., Chen Z., Fang L.T., Zhao Y., Lack J., Guan M., Zhu B., Jaeger E., Kerrigan L., et al. Toward best practice in cancer mutation detection with whole-genome and whole-exome sequencing. Nat. Biotechnol. 2021;39:1141–1150. doi: 10.1038/s41587-021-00994-5. - DOI - PMC - PubMed

LinkOut - more resources