. 2024 Dec 10;25(24):13256.
doi: 10.3390/ijms252413256.

Alterations in the Rice Coleoptile Metabolome During Elongation Under Submergence Stress

Affiliations

Alterations in the Rice Coleoptile Metabolome During Elongation Under Submergence Stress

Vladislav V Yemelyanov et al. Int J Mol Sci. .

Abstract

Plants known as obligate aerobes developed different mechanisms to overcome the damage incurred under oxygen limitation. One of the survival strategies to have commonly appeared in hydrophytic plants is the escape strategy, which accelerates plant axial organs' growth in order to escape hypoxic conditions as soon as possible. The present study aimed to distinguish the alterations in coleoptile elongation, viability and metabolic profiles in coleoptiles of slow- and fast-growing rice varieties. All the parameters were tested at 3, 5 and 7 days after sowing, to highlight changes during seedling development in normal and submerged conditions. The obtained results indicated that coleoptile elongation correlated with higher resistance to oxygen deprivation. GS-MS-based metabolic profiling indicated that coleoptiles of the fast-growing cultivar accumulated higher amounts of sugar phosphates, disaccharides, fatty acid derivatives and sterols, which are important for maintaining growth, membrane stability and viability. The slow-growing variety was characterized by a greater abundance of carboxylates, including lactate and phosphoric acid, indicating an energy crisis and cytosol acidification, leading to cell damage and low tolerance. Therefore, a metabolomics approach could be used for phenotyping (chemotyping) in the large-scale screening of newly developed varieties with higher tolerance to oxygen deprivation.

Keywords: Oryza sativa; adaptation; coleoptile; elongation; metabolomics; submergence; tolerance.


Conflict of interest statement

The authors declare no conflicts of interest.

Figures

Figure 1
Figure 1
The length of (a) and electrolyte leakage from (b) the coleoptiles of the slow-growing Amethyst and the fast-growing Kuban 3 varieties of rice during normoxic and hypoxic germination. Values with the different letters are significantly different at p < 0.05, according to Tukey’s test. DAS—days after sowing.
Figure 2
Figure 2
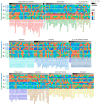
Heatmap of normalized and scaled mean metabolite contents in coleoptiles of slow-growing cv. Amethyst (A) and fast-growing cv. Kuban 3 (K) under normoxic and hypoxic germination. Metabolites were divided into groups by chemical properties. Gray annotation above is a heat map of the normalized median abundance. Metabolite key: RI—retention index, -P—phosphate, disacch—disaccharide, compsug—complex sugars or molecules with sugar parts (glycosides), FA—fatty acid, MG—monoacylglycerol.
Figure 3
Figure 3
Unsupervised analysis of metabolite profiles from rice coleoptiles. Comparison of hypoxic action on both varieties (a), slow-growing cv. Amethyst (b) and fast-growing cv. Kuban 3 (c). PCA score plots. Ellipses are 95% confidence intervals.
Figure 4
Figure 4
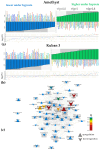
Differently accumulated metabolites under hypoxia after 3 days. Bar plots of factor loadings of the predictive components from OPLS-DA models for cv. Amethyst (a) and Kuban 3 (b). Scattered plot—log2(FC(hypoxia/normoxia)). (c)—Metabolite set enrichment analysis based on loadings from OPLS-DA classification for cv. Amethyst. Nodes are the paths extracted from KEGG. If the paths share metabolites, then they are connected by edges. Color—significance of influence on this pathway, size—strength of influence (|NES|), upward triangles—up-regulation under hypoxia, downward direction—down-regulation.
Figure 5
Figure 5
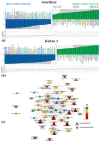
Differently accumulated metabolites under hypoxia after 5 days. Bar plots of factor loadings of the predictive components from OPLS-DA models for cv. Amethyst (a) and Kuban 3 (b). Scatter plot—log2(FC(hypoxia/normoxia)). (c)—Metabolite set enrichment analysis based on loadings from OPLS-DA classification for cv. Amethyst. Nodes are the paths extracted from KEGG. If the paths share metabolites, then they are connected by edges. Color—significance of influence on this pathway, size—strength of influence (|NES|), upward triangles—up-regulation under hypoxia, downward direction—down-regulation.
Figure 6
Figure 6
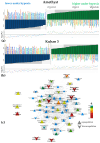
Differently accumulated metabolites under hypoxia after 7 days. Bar plots of factor loadings of the predictive components from OPLS-DA models for cv. Amethyst (a) and Kuban 3 (b). Scatter plot—log2(FC(hypoxia/normoxia)). (c)—Metabolite set enrichment analysis based on loadings from OPLS-DA classification for cv. Amethyst. Nodes are the paths extracted from KEGG. If the paths share metabolites, then they are connected by edges. Color—significance of influence on this pathway, size—strength of influence (|NES|), upward triangles—up-regulation under hypoxia, downward direction—down-regulation.
Figure 7
Figure 7
Metabolic differences between cultivars Amethyst and Kuban 3 under hypoxia. (a)—PCA score plots at 3, 5 and 7 DAS; (b)—OPLS-DA model parameters, illustrating leveling of intracultivar differences in hypoxia, but not in normoxia. p1%—percent of variance, related to predictive component.
Figure 8
Figure 8
Metabolites differently accumulated in cv. Amethyst and cv. Kuban 3 under 3 (a) and 5 (b) days of hypoxia in two cultivars. Bar plots of factor loadings of the predictive components from OPLS-DA models. Scatter plot—log2(FC(hypoxia/normoxia)).
Figure 9
Figure 9
Mapping of metabolites by correlations of contents (Pearson’s correlation, q < 0.05) (a); histograms of node degree distributions (b); dendrogram of hierarchical clustering by the similarity of edge sets (c).

Similar articles

References

    1. Mommer L., Visser E.J.W. Underwater photosynthesis in flooded terrestrial plants: A matter of leaf plasticity. Ann. Bot. 2005;96:581–589. doi: 10.1093/aob/mci212. - DOI - PMC - PubMed
    1. Bailey-Serres J., Voesenek L.A.C.J. Flooding stress: Acclimations and genetic diversity. Annu. Rev. Plant Biol. 2008;59:313–339. doi: 10.1146/annurev.arplant.59.032607.092752. - DOI - PubMed
    1. Polko J.K., Voesenek L.A.C.J., Peeters A.J.M., Pierik R. Petiole hyponasty: An ethylene-driven, adaptive response to changes in the environment. AoB Plants. 2011;2011:plr031. doi: 10.1093/aobpla/plr031. - DOI - PMC - PubMed
    1. Sauter M. Root responses to flooding. Curr. Opin. Plant Biol. 2013;16:282–286. doi: 10.1016/j.pbi.2013.03.013. - DOI - PubMed
    1. Voesenek L.A.C.J., Bailey-Serres J. Flood adaptive traits and processes: An overview. New Phytol. 2015;206:57–73. doi: 10.1111/nph.13209. - DOI - PubMed

LinkOut - more resources