. 2024 Dec 11;25(24):13296.
doi: 10.3390/ijms252413296.

Loss of Glutathione-S-Transferase Theta 2 (GSTT2) Modulates the Tumor Microenvironment and Response to BCG Immunotherapy in a Murine Orthotopic Model of Bladder Cancer

Affiliations

Loss of Glutathione-S-Transferase Theta 2 (GSTT2) Modulates the Tumor Microenvironment and Response to BCG Immunotherapy in a Murine Orthotopic Model of Bladder Cancer

Mugdha V Patwardhan et al. Int J Mol Sci. .

Abstract

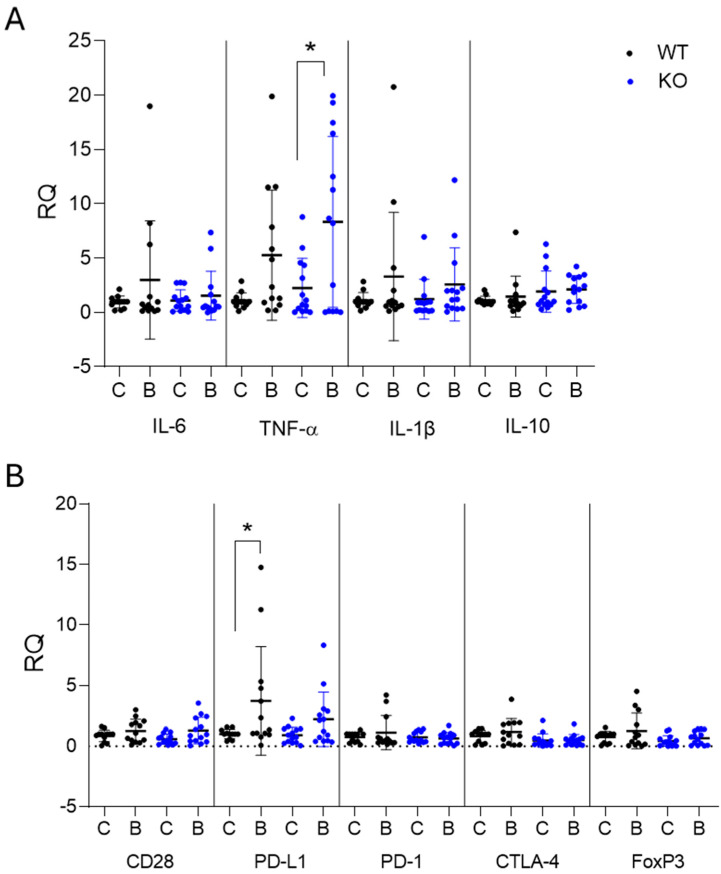
Loss of the glutathione-S-transferases Theta 2 (Gstt2) expression is associated with an improved response to intravesical Mycobacterium bovis, Bacillus Calmette-Guérin (BCG) immunotherapy for non-muscle-invasive bladder cancer (NMIBC) patients who receive fewer BCG instillations. To delineate the cause, Gstt2 knockout (KO) and wildtype (WT) C57Bl/6J mice were implanted with tumors before treatment with BCG or saline. RNA was analyzed via single-cell RNA sequencing (scRNA-seq) and real-time polymerase chain reaction (RT-PCR). BCG induced PD-L1 expression in WT mice bladders, while pro-inflammatory TNF-α was upregulated in KO bladders. ScRNA-seq analysis showed that Gstt2 WT mice bladders had a higher proportion of matrix remodeling fibroblasts, M2 macrophages, and neuronal cells. In KO mice, distinct tumor cell types, activated fibroblasts, and M1 macrophages were enriched in the bladders. In WT bladders, the genes expressed supported tumorigenesis and immunosuppressive PD-L1 expression. In contrast, Gstt2 KO bladders expressed genes involved in inflammation, immune activation, and tumor suppression. An 11-gene signature (Hmga2, Peak 1, Kras, Slc2a1, Ankfn1, Ahnak, Cmss1, Fmo5, Gphn, Plec, Gstt2), derived from the scRNA-seq analysis predicted response in NMIBC patients (The Cancer Genome Atlas (TCGA) database). In conclusion, our results indicate that patients with WT Gstt2 may benefit from anti-PD-L1 checkpoint inhibition therapy.

Keywords: BCG; PD-L1; bladder cancer; glutathione S-transferase theta 2; immunotherapy; inflammation; single-cell gene expression analysis; urinary bladder neoplasms.


Conflict of interest statement

The authors have no conflicts of interest to declare.

Figures

Figure 1
Figure 1
Tumor growth in the orthotopic model. (A) The murine bladder cancer cells expressing human prostate-specific antigen (MB49–PSA) were implanted orthotopically (1 × 10⁵ cells) into Gstt2 WT and KO C57BL6/J female mice. One week post-implantation, the mice were treated weekly with either saline or 3 × 10⁶ colony forming units (CFU) BCG instillations for 4 weeks. Urine samples were collected weekly, and secreted urinary PSA normalized with creatinine levels was assessed by ELISA for (B) WT and (C) KO mice. Error bars represent the standard error of the mean (SEM). (D) Bladders were harvested one day after the fourth BCG instillation and weighed; error bars represent standard deviation, and statistical significance was determined using one–way ANOVA (* p–value < 0.05). (E) Quantitative real–time PCR was used to measure PSA expression in whole bladders (WT–C: n = 14, WT–B: n = 18, KO–C: n = 20, KO–B: n = 16). The relative quantification (RQ) values were used to categorize tumors as small (0.0 < RQ ≤ 0.5), medium (0.5 < RQ ≤ 1.5), or large (RQ ≥ 1.5). Mice were cured if the cycle threshold (CT) value >35. WT—Wildtype, KO—Knockout, C—Control Saline, B—BCG.
Figure 2
Figure 2
Expression of inflammatory and exhaustion-associated genes in bladders from WT and KO mice. MB49–PSA bladder cancer cells were implanted orthotopically into Gstt2 WT and KO C57BL6/J female mice. The mice were treated with weekly BCG instillations one week post-implantation for 4 weeks. Bladders were harvested one day after the fourth BCG instillation, and RNA was extracted for quantitative real–time PCR. (A) The expression of cytokines and (B) immune activation and exhaustion markers was compared in WT and KO mice. Comparisons of means were performed using one–way ANOVA, and the mean of each group was compared to the mean of every other group using Tukey’s test for multiple comparisons. * Significant differences were observed when comparing control to BCG–treated mice (* p–value < 0.05). WT—Wildtype, KO—Knockout.
Figure 3
Figure 3
Single–cell RNA sequencing of whole bladders from WT and KO mice. MB49–PSA bladder cancer cells were implanted orthotopically into Gstt2 WT and KO C57BL6/J female mice. The mice were treated with weekly BCG instillations one week post-implantation for 4 weeks. Bladders were harvested one day after the fourth BCG instillation, and single cells were isolated for single–cell RNA sequencing. (A) Standard principal component analysis (PCA) and uniform manifold approximation and projection (UMAP) were used to cluster cells, and the top differentially expressed genes between the clusters were used to determine cell type. (B) The UMAP plots were segregated by genotype to compare differences in the frequency of cell types between WT and KO mice. WT—Wildtype, KO—Knockout.
Figure 4
Figure 4
Differentially expressed genes between WT and KO backgrounds within individual cell clusters of the bladder TME. The “FindAllMarkers” function was used to identify differentially expressed genes (DEG) within each cell cluster between WT and KO backgrounds. In total, 12 clusters with differentially expressed genes were identified based on log2(Fold Change) > 0.5 and p-value < 0.05. The top 10 differential genes for each cell cluster are presented (from highest to lowest log2(Fold Change)). The genes in the blue font were validated in MB49–PSA cells, and those in the red font were selected for validation in both MB49–PSA cells and the murine model. WT—Wildtype, KO—Knockout.
Figure 5
Figure 5
Correlation of select genes with clinical outcomes in bladder cancer patients. The expression of the genes identified by sc–RNAseq was compared in bladder cancer patients by interrogation of the TCGA database using the GEPIA software version 2 [21]. The hazard risk associated with each gene with respect to (A) overall survival or (B) disease–free survival is shown: red = increased risk, blue = decreased risk; outlined boxes = significant. (C) Eleven genes (Ankfn1, Gstt2, Plec, Gphn, Fmo5, Cmss1, Ahnak, Slc2a1, Kras, Peak1, Hmga2) were selected to form a gene signature. Disease–free survival was assessed with respect to the 11 genes (normalized with RPS27a) in bladder cancer patients and by bladder cancer sub–type, namely (D) papillary and (E) non-papillary tumors.

Similar articles

Cited by

References

    1. Bray F., Laversanne M., Sung H., Ferlay J., Siegel R.L., Soerjomataram I., Jemal A. Global cancer statistics 2022: GLOBOCAN estimates of incidence and mortality worldwide for 36 cancers in 185 countries. CA Cancer J. Clin. 2024;74:229–263. doi: 10.3322/caac.21834. - DOI - PubMed
    1. Zhu S., Yu W., Yang X., Wu C., Cheng F. Traditional Classification and Novel Subtyping Systems for Bladder Cancer. Front. Oncol. 2020;10:102. doi: 10.3389/fonc.2020.00102. - DOI - PMC - PubMed
    1. Mossanen M., Gore J.L. The burden of bladder cancer care: Direct and indirect costs. Curr. Opin. Urol. 2014;24:487–491. doi: 10.1097/MOU.0000000000000078. - DOI - PubMed
    1. Lenis A.T., Lec P.M., Chamie K., Mshs M.D. Bladder Cancer: A Review. JAMA. 2020;324:1980–1991. doi: 10.1001/jama.2020.17598. - DOI - PubMed
    1. Lamm D.L., Morales A. A BCG success story: From prevention of tuberculosis to optimal bladder cancer treatment. Vaccine. 2021;39:7308–7318. doi: 10.1016/j.vaccine.2021.08.026. - DOI - PubMed

MeSH terms