. 2024 Dec 11;25(24):13306.
doi: 10.3390/ijms252413306.

Colon Tumor Discrimination Combining Independent Endoscopic Probe-Based Raman Spectroscopy and Optical Coherence Tomography Modalities with Bayes Rule

Affiliations

Colon Tumor Discrimination Combining Independent Endoscopic Probe-Based Raman Spectroscopy and Optical Coherence Tomography Modalities with Bayes Rule

David L Vasquez et al. Int J Mol Sci. .

Abstract

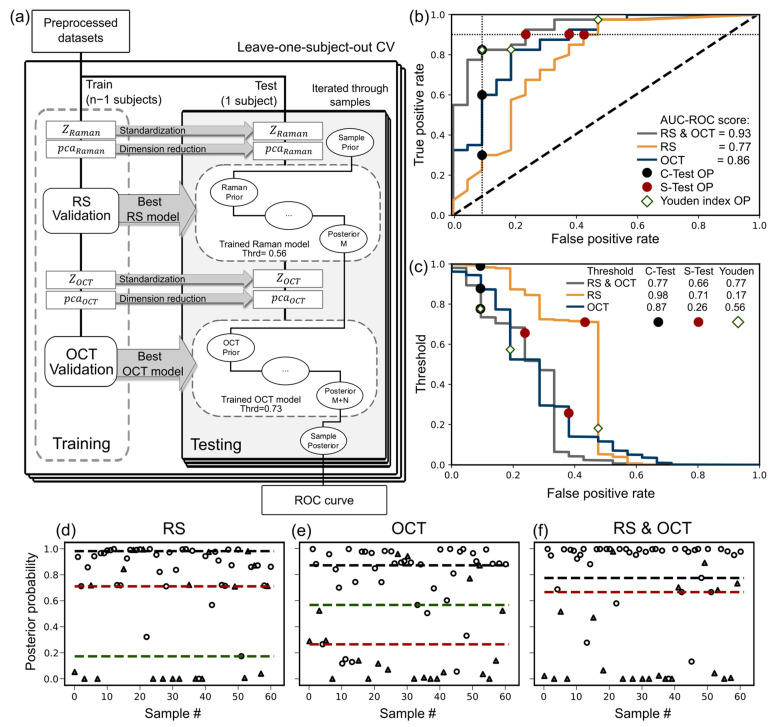
Colorectal cancer is one of the most prevalent forms of cancer globally. The most common routine diagnostic methods are the examination of the interior of the colon during colonoscopy or sigmoidoscopy, which frequently includes the removal of a biopsy sample. Optical methods, such as Raman spectroscopy (RS) and optical coherence tomography (OCT), can help to improve diagnostics and reduce the number of unnecessary biopsies. For in vivo use, we have developed fiber-optic probes, one for single-point Raman measurements and one for volumetric OCT. Here, we present the results of a clinical study using these fiber-optic probes in an ex vivo setting. The goal was to evaluate the beneficial effect of combining these two modalities on the AUC ROC score of the machine learning models for the discrimination of cancerous and healthy tissue. In the initial stage of the investigation, both modalities were validated separately using linear discriminant analysis. RS was subjected to spectral preprocessing, while OCT underwent texture feature extraction. Subsequently, both modalities were integrated using the Bayes rule, resulting in an enhanced area under the curve score of 0.93, representing an improvement over the 0.77 score for Raman spectroscopy and 0.86 for OCT.

Keywords: OCT; Raman spectroscopy; biophotonics; clinical application; colon cancer; fiber-optic probes; invaScope; optical coherence tomography.


Conflict of interest statement

The authors declare no conflicts of interest.

Figures

Figure 1
Figure 1
(a) Mean healthy spectra and mean tumor spectra with ±1 standard deviation. Representative biomolecule bands are highlighted. (b) p-value result from Welch’s test; bands with a statistical relevance of values < 10−10 are highlighted and used as the input dataset for the RS LDA classifier. (c) ROC curves for the RS and OCT LDA classifiers showing the optimal operating point adopting the Youden index. (d) FPR vs. threshold plot showing the corresponding threshold related to the optimal operating point; (e,f) are two tumor samples with dense collagen microstructures characteristic of desmoplastic tumor patterns and the corresponding OCT enface image. The red box highlights the zoomed-in area of the histological slide, showing an equivalent field of view.
Figure 2
Figure 2
(a) Model validation algorithm to assess the performance of the Bayes classification method combining the RS and OCT endoscopic probe measurement. (b) ROC curves of model validation for RS (yellow), OCT (blue), and the combined RS and OCT (gray) modalities. The operating points were chosen based on the Youden index (diamonds), the confirmatory test (black circles) and the screening test (red circles). (c) corresponds to the optimal decision threshold for the posterior tumor probabilities, (d) the posterior probabilities of the Bayes classification method using only RS, (e) using only OCT, and (f) using the combination RS and OCT. The dashed lines represent decision thresholds, and the triangles and circles represent the healthy and tumor samples, respectively.
Figure 3
Figure 3
Sample dataset summary. (a) A total of 61 tissue samples from 27 patients were used in the analysis. The area of each sample is determined from the H&E-stained and annotated images. The blue color labels the healthy samples and the red color labels tumors. Since the tumor samples could contain mixed regions, i.e., tumor and healthy regions, the area ratio of tumor and healthy tissue was calculated for each individual biopsy. (b) Example dataset with 4 subjects, 8 samples, and 36 records showing 50–50% record-wise, sample-wise, and subject-wise data split. For the record-wise data split, it is possible to balance the partitions, while in the other two cases, the balance may vary, potentially causing a data distribution mismatch. In the subject-wise data, split eliminates the issue of identity confounding. In the graph, the label color means blue: healthy and gray: tumor; the record color belongs to a single sample.
Figure 4
Figure 4
(a) step-by-step operations used for the RS preprocessing of the raw Raman data, (b) RS model validation algorithm of an LDA classifier for tumor tissue diagnosis. Leave-one-subject-out CV was implemented to assess the classifier's performance. In the training phase, the data were standardized using a Z-score function, and the dimension was reduced using PCA. The validation was built with a hyperparameter tuning loop, a nested leave-one-subject-out CV, and the AUC ROC score as a merit function. In the test phase, the data were standardized and reduced in dimension using the same functions from the training phase. The best score-wise performing LDA model from the validation was used to infer the test set and to report the tumor probability of each record. The ROC curve of the model validation was reported.
Figure 5
Figure 5
(a) H&E-stained tumor sample showing the endoscopic probe OCT measurement field of view (red circle) in relation to the sample and the properties of the OCT image dataset. (b) Selected methods for texture feature extraction with the implemented parameters. (c) OCT model validation algorithm to assess the performance of an LDA model trained with the OCT image dataset. The algorithm standardizes and reduces the dimension of each texture feature individually to later concatenate the PCA coefficients in a composite feature vector. From this point, the algorithm is the same as the one used for RS model validation.
Figure 6
Figure 6
Bayes rule for M diagnostic tests applied to calculate the final posterior probability. The decision threshold (Thrd) defines the operating point on the ROC curve, determining the FPR and TPR. Using this information, along with the diagnostic test result, the posterior probability can be calculated after each test. Here, the diagnostic test M is an individual measurement with either RS or OCT of a sample where multiple measurements could take place per sample.

References

    1. FerFerlay J., Ervik M., Lam F., Laversanne M., Colombet M., Mery L., Piñeros M., Znaor A., Soerjomataram I., Bray F. International Agency for Research on Cancer; Lyon, France: [(accessed on 18 October 2024)]. Global Cancer Observatory: Cancer Today. Available online: https://gco.iarc.who.int/media/globocan/factsheets/populations/900-world....
    1. World Health Organization Colorectal Cancer, Key Facts. [(accessed on 18 October 2024)]. Available online: https://www.who.int/news-room/fact-sheets/detail/colorectal-cancer.
    1. Roshandel G., Ghasemi-Kebria F., Malekzadeh R. Colorectal Cancer: Epidemiology, Risk Factors, and Prevention. Cancers. 2024;16:1530. doi: 10.3390/cancers16081530. - DOI - PMC - PubMed
    1. Tariq K., Ghias K. Colorectal Cancer Carcinogenesis: A Review of Mechanisms. Cancer Biol. Med. 2016;13:120–135. doi: 10.20892/j.issn.2095-3941.2015.0103. - DOI - PMC - PubMed
    1. Fearon E.F., Vogelstein B. A Genetic Model for Colorectal Tumorigenesis. Cell. 1990;61:759–767. doi: 10.1016/0092-8674(90)90186-I. - DOI - PubMed

LinkOut - more resources