

P2 Receptor Antagonists Rescue Defective Heme Content in an In Vitro SLC25A38-Associated Congenital Sideroblastic Anemia Cell Model
- PMID: 39769087
- PMCID: PMC11679772
- DOI: 10.3390/ijms252413314
P2 Receptor Antagonists Rescue Defective Heme Content in an In Vitro SLC25A38-Associated Congenital Sideroblastic Anemia Cell Model
Abstract
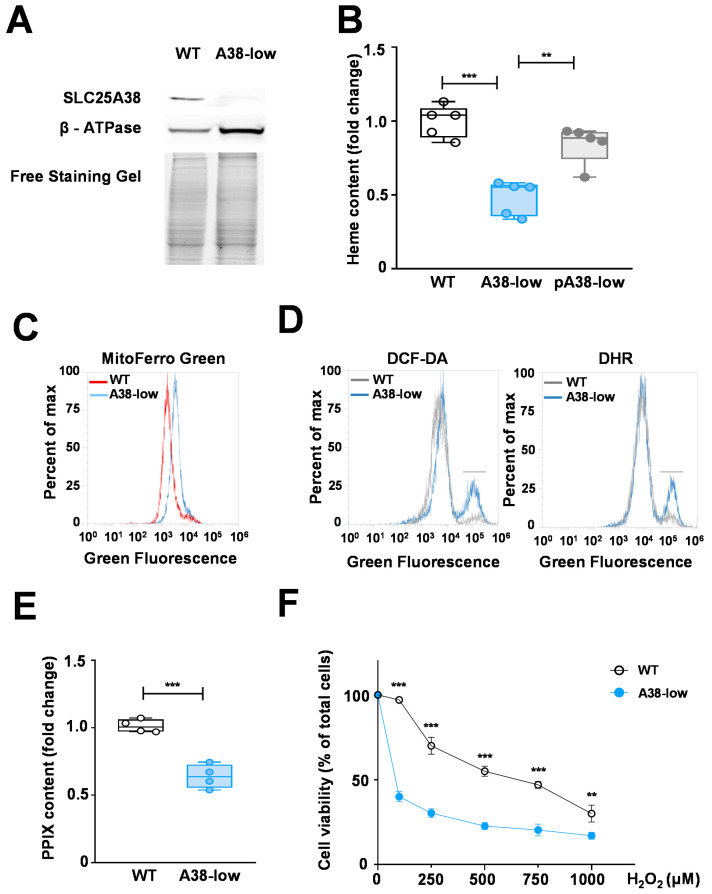
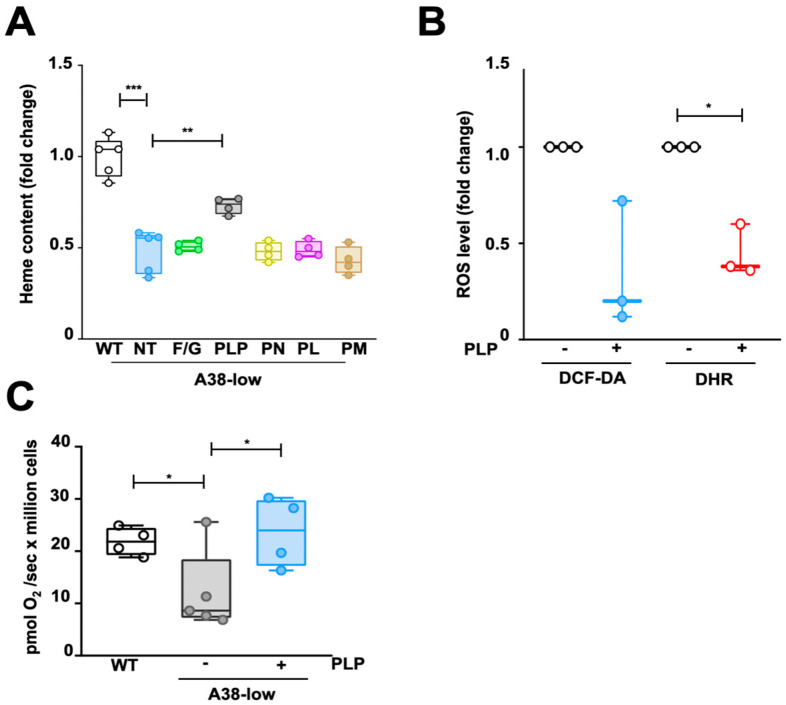
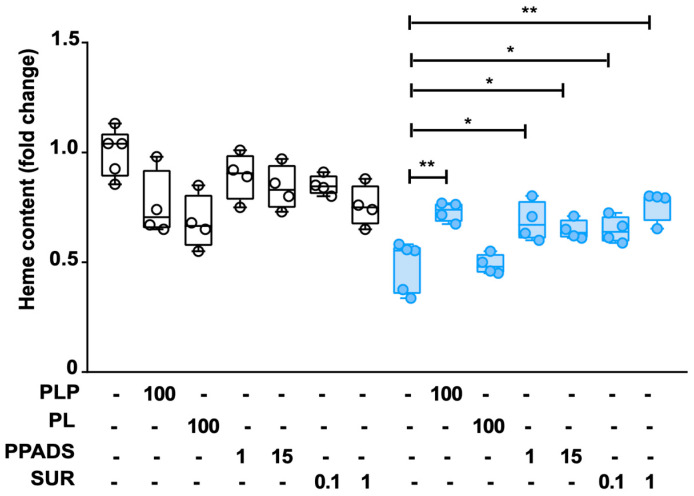
Mutations in the SLC25A38 gene are responsible for the second most common form of congenital sideroblastic anemia (CSA), a severe condition for which no effective treatment exists. We developed and characterized a K562 erythroleukemia cell line with markedly reduced expression of the SLC25A38 protein (A38-low cells). This model successfully recapitulated the main features of CSA, including reduced heme content and mitochondrial respiration, increase in mitochondrial iron, ROS levels and sensitivity to oxidative stress. Notably, our study uncovered a new role for extracellular pyridoxal 5'-phosphate (PLP) and other P2 receptor antagonists in rescuing the altered parameters of A38-low cells (for example, the heme content of the A38-low cells was increased from about 50% to about 80% by the P2 receptor antagonists treatment compared with the value of the controls). These findings suggest that targeting P2 receptors could represent a promising therapeutic approach for SLC25A38-associated CSA.
Keywords: P2 receptors; SLC25A38; congenital sideroblastic anemia (CSA); heme biosynthesis; iron dyshomeostasis; mitochondrial carriers; oxidative stress; pyridoxal 5′-phosphate.
Conflict of interest statement
A.S., S.D.S., I.A., R.R, A.I., L.P., E.P., and C.M.T.M. are in the process of filing a patent related to the therapeutic interventions identified in this study. F.P., A.V., G.A., A.P., C.T.S., A.F., Y.W.J., E.T.K., G.F., and F.P. declare no competing financial interests.
Figures
Similar articles
-
SLC25A38 is required for mitochondrial pyridoxal 5'-phosphate (PLP) accumulation.Nat Commun. 2025 Jan 24;16(1):978. doi: 10.1038/s41467-025-56130-3. Nat Commun. 2025. PMID: 39856062 Free PMC article.
-
Glycine and Folate Ameliorate Models of Congenital Sideroblastic Anemia.PLoS Genet. 2016 Jan 28;12(1):e1005783. doi: 10.1371/journal.pgen.1005783. eCollection 2016 Jan. PLoS Genet. 2016. PMID: 26821380 Free PMC article.
-
Mutations in mitochondrial carrier family gene SLC25A38 cause nonsyndromic autosomal recessive congenital sideroblastic anemia.Nat Genet. 2009 Jun;41(6):651-3. doi: 10.1038/ng.359. Epub 2009 May 3. Nat Genet. 2009. PMID: 19412178
-
Molecular pathophysiology and genetic mutations in congenital sideroblastic anemia.Free Radic Biol Med. 2019 Mar;133:179-185. doi: 10.1016/j.freeradbiomed.2018.08.008. Epub 2018 Aug 8. Free Radic Biol Med. 2019. PMID: 30098397 Review.
-
Pathophysiology and genetic mutations in congenital sideroblastic anemia.Pediatr Int. 2013 Dec;55(6):675-9. doi: 10.1111/ped.12217. Pediatr Int. 2013. PMID: 24003969 Review.
References
-
- Le Rouzic M.A., Fouquet C., Leblanc T., Touati M., Fouyssac F., Vermylen C., Jäkel N., Guichard J.F., Maloum K., Toutain F., et al. Non syndromic childhood onset congenital sideroblastic anemia: A report of 13 patients identified with an ALAS2 or SLC25A38 mutation. Blood Cells Mol. Dis. 2017;66:11–18. doi: 10.1016/j.bcmd.2017.07.003. - DOI - PubMed
-
- Bergmann A.K., Campagna D.R., McLoughlin E.M., Agarwal S., Fleming S.D., Bottomley S.S., Neufeld E.J. Systematic molecular genetic analysis of congenital sideroblastic anemia: Evidence for genetic heterogeneity and identification of novel mutations. Pediatr. Blood Cancer. 2010;54:273–278. doi: 10.1002/pbc.22244. - DOI - PMC - PubMed
MeSH terms
Substances
Grants and funding
- RBSI14LTIS "Molecular and pathogenetic mechanism of congenital sideroblastic anemia associated with the SLC25A38 gene deficiency" to E.P./Italian Ministry of Education, Universities, and Research
- 2017PAB8EM_005 "Membrane transporters, the doors of cellular metabolism. Investigations of biochemical features structure/function relationships, metabolic regulation and physiopathological aspects by in vitro and in vivo experimental models" to E.P.;/Ministry of University and Research
- CA217809 to E.T.K./U.S. National Cancer Institute
LinkOut - more resources
Full Text Sources
Research Materials
