. 2024 Dec 13;25(24):13387.
doi: 10.3390/ijms252413387.

Keratinocyte-Mediated Antigen Presentation in Psoriasis: Preliminary Insights from In Vitro Studies

Affiliations

Keratinocyte-Mediated Antigen Presentation in Psoriasis: Preliminary Insights from In Vitro Studies

Katarzyna Zima et al. Int J Mol Sci. .

Abstract

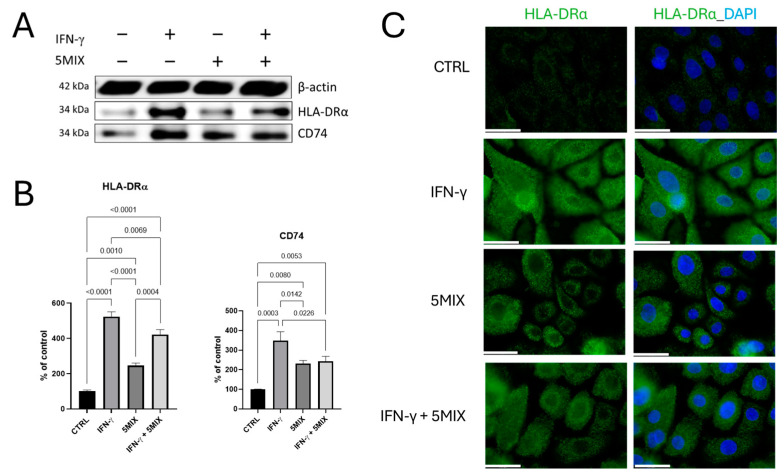
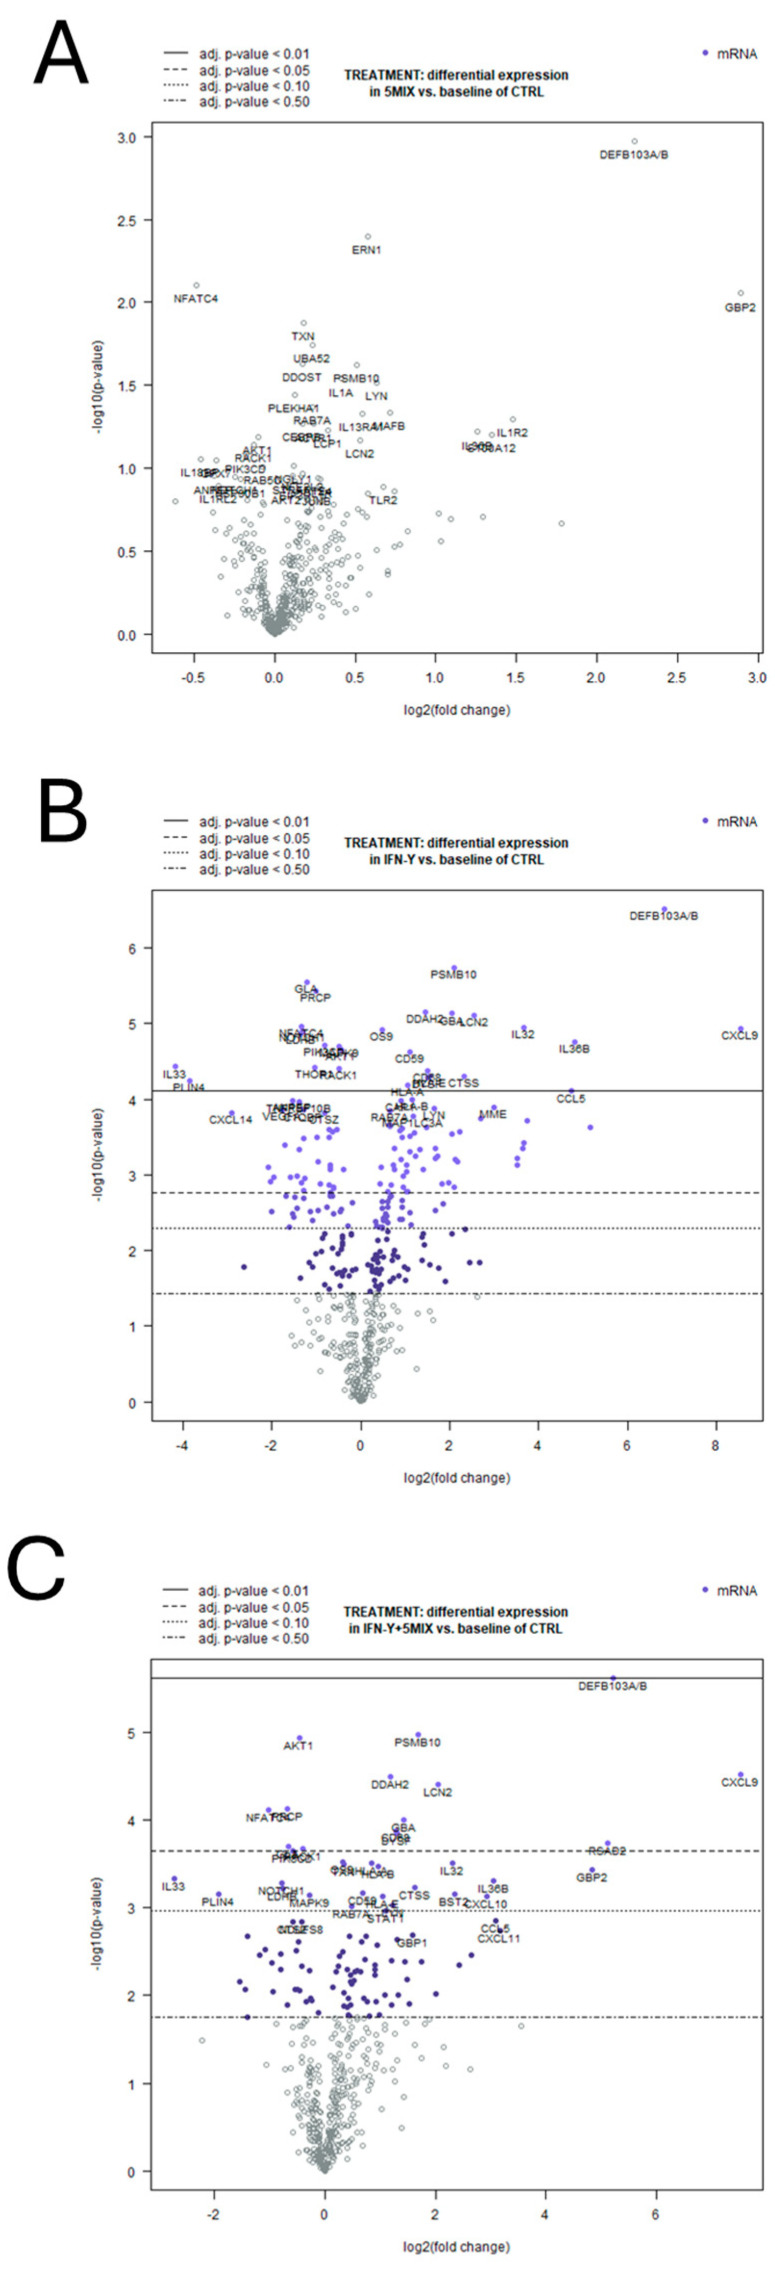
Antigen presentation plays a critical role in the pathogenesis of immune-mediated disorders. This study aimed to investigate the effects of IFN-γ and a cytokine mix (5MIX: IL-1α, IL-17A, IL-22, OsM, and TNF-α) on the antigen-presenting capabilities of keratinocytes, with a specific focus on immune-mediated dermatological conditions such as psoriasis (Ps). To achieve this, keratinocytes were treated with IFN-γ and 5MIX, and their impact on the expression of key antigen-presentation molecules, HLA-DRα and CD74, was assessed. Transcriptomic analysis revealed that IFN-γ alone altered the expression of 254 genes, highlighting its central role in modulating immune responses, including the recruitment of immune cells and regulation of inflammation. Temporal experiments further demonstrated that IFN-γ and 5MIX enhanced early endocytic activity and lysosomal degradation pathways, both essential for effective antigen presentation and T-cell activation. To extend these findings to a clinical context, a co-culture model using keratinocytes derived from psoriatic patients was established. This model revealed increased cytokine production following antigen stimulation, indicating robust and consistent CD4+ and naïve T-cell responses. These results elucidate the complex dynamics of cytokine signaling and antigen presentation in keratinocytes, providing insights into potential therapeutic strategies for immune-mediated skin disorders like Ps.

Keywords: MHC class II; autoimmune diseases; keratinocytes; psoriasis.


Conflict of interest statement

The authors declare no conflicts of interest.

Figures

Figure 1
Figure 1
Elevation of HLA-DRα and CD74 expression in IFN-γ stimulated Normal Human Epidermal Keratinocytes (NHEKs) 2D in vitro model. The effect of interferon gamma (IFN-γ; 500 U/mL); 5MIX: interleukin (IL)-1α, IL-17A, IL-22, oncostatin M (OsM), and tumor necrosis factor alpha (TNF-α), at 2 ng/mL each; and the combination of 5MIX (2 ng/mL each) with IFN-γ (500 U/mL) on the levels of HLA-DRα and CD74 (A) proteins, in an in vitro 2D model of NHEK. The graphs represent the results of densitometric analyses normalized to β-actin, presented as a percentage of the control, non-treated cells (B). Representative immunofluorescence images (C) show the subcellular localization of HLA-DRα (green) with DAPI-stained nuclei (blue). Ten microscopic fields, each comprising 50–100 cells, were arbitrarily chosen for imaging. The scale bar equals 35.6 µm. All experiments were conducted in biological triplicates (n = 3), and comparisons with p < 0.05 are displayed.
Figure 2
Figure 2
Synergistic enhancement of ovalbumin (OVA, used as a model antigen) internalization, through colocalization with early endosomal and lysosomal markers was analyzed in Normal Human Epidermal Keratinocytes (NHEKs) treated with interferon gamma (IFN-γ; 500 U/mL) and/or 5MIX, a cytokine mix comprising interleukin (IL)-1α, IL-17A, IL-22, oncostatin M (OsM), and tumor necrosis factor alpha (TNF-α), each at 2 ng/mL, in a time-dependent study. Ten microscopic fields, each containing 50–100 cells, were arbitrarily chosen for each of the three separate experiments (n = 3), and representative images were captured. The scale bar equals 10 µm. The colocalization of OVA with the early endosome marker 1 (EEA1) and lysosomal-associated membrane protein 1 (LAMP1) was evaluated at four time points: 15 min (A), 30 min (B), 45 min (C), and 60 min (D) using an in vitro 2D NHEK model. Quantification of colocalization levels was performed using Pearson’s correlation coefficient (E). All experiments were conducted in biological triplicates (n = 3), and comparisons with p < 0.05 are indicated.
Figure 3
Figure 3
The transcriptomic landscape of Normal Human Epidermal Keratinocytes (NHEKs) unveils differential expression paradigms in response to 5MIX (interleukin (IL)-1α, IL-17A, IL-22, oncostatin M (OsM), and tumor necrosis factor alpha (TNF-α), at 2 ng/mL each) and/or interferon gamma (IFN-γ) at 500 U/mL stimulation. A heatmap visualization of gene expression data from NHEKs treated with 5MIX; IFN-γ at 500 U/mL; and a combination of 5MIX and IFN-γ (A). The intensity of color reflects the level of gene expression: deep red represents higher expression levels, while dark blue signifies lower expression levels. Panel (B) illustrates a Venn diagram comparing the number of differentially expressed genes (DEGs) across the three experimental conditions: 5MIX, IFN-γ, and 5MIX + IFN-γ. The numbers in each section represent the count of unique or overlapping DEGs in the different treatment groups. IFN-γ treatment resulted in 254 DEGs, 5MIX in 17 DEGs, and the combination of 5MIX + IFN-γ modulated 164 DEGs. Overlapping regions indicate genes shared among the conditions. The Venn diagram was generated using the InteractiVenn web-based tool [13]. All experiments were conducted in biological triplicates (n = 3), and comparisons with p < 0.05 are displayed.
Figure 4
Figure 4
Differential gene expression in Normal Human Epidermal Keratinocytes (NHEKs) in response to 5MIX (interleukin (IL)-1α, IL-17A, IL-22, oncostatin M (OsM), and tumor necrosis factor alpha (TNF-α), at 2 ng/mL each) and/or interferon gamma (IFN-γ) at 500 U/mL stimulation. Volcano plots illustrate the statistical significance versus the magnitude of gene expression changes in NHEKs upon treatment with 5MIX (A), IFN-γ (B), and their combination (C). Each point on the plots represents a gene, with the x-axis displaying the log2 fold change and the y-axis showing the negative log10 of the adjusted p-value. Genes with statistically significant differential expression are highlighted in blue and annotated with their respective gene symbols. The horizontal dashed lines represent thresholds for adjusted p-values: p < 0.01, p < 0.05, and p < 0.10. These thresholds demarcate varying levels of statistical significance, with genes above the dashed lines meeting the respective significance criteria. All experiments were conducted in biological triplicates (n = 3).
Figure 5
Figure 5
Pathway enrichment analysis of differentially expressed genes (DEGs) in Normal Human Epidermal Keratinocytes (NHEKs) treated with 5MIX (interleukin (IL)-1α, IL-17A, IL-22, oncostatin M (OsM), and tumor necrosis factor alpha (TNF-α), at 2 ng/mL each) and/or interferon gamma (IFN-γ) at 500 U/mL. Bubble plots illustrate Reactome pathway enrichment for DEGs in NHEKs upon treatment with 5MIX (A), IFN-γ (B), and their combination (C), compared to the control (CTRL). The x-axis shows the Reactome pathways, while the y-axis represents the significance level of enrichment (−log10 of the false discovery rate (FDR)). Bubble sizes correspond to the number of genes associated with each pathway, while the color gradient indicates FDR values, with darker blue representing higher statistical significance and lighter green reflecting less significant enrichment. All analyses were conducted using the STRING platform (https://string-db.org/; accessed on 23 November 2024) [14], and all experiments were performed in biological triplicates (n = 3).
Figure 6
Figure 6
Treatment with 5MIX (IL-1α, IL-17A, IL-22, oncostatin M (OsM), and TNF-α at 2 ng/mL each) and/or IFN-γ at 500 U/mL, in combination with ovalbumin (OVA), significantly modulates cytokine production in naïve CD4+ and CD4+ lymphocytes. The levels of IFN-γ, IL-2, IL-10, and IL-17A cytokines in the supernatants obtained from a co-culture of Normal Human Epidermal Keratinocytes (NHEKs) and normal CD4+ lymphocytes (A), and IL-2, IL-10, and IL-17A in the supernatants from a co-culture of keratinocytes and normal naïve CD4+ lymphocytes (B). NHEKs were stimulated with a combination of 5MIX; IFN-γ; and the combination of 5MIX with IFN-γ for 24 h. Subsequently, OVA at 100 µg/mL was introduced as the antigen. After 24 h, the cultures were washed, and CD4+ lymphocytes were added for an additional 24 h. The quantification of cytokine production was performed using Luminex® assays. All experiments were conducted in biological triplicates (n = 3), and comparisons with p < 0.05 are displayed.
Figure 7
Figure 7
Biological interventions exhibit the modulation of immunological responses in psoriasis compared to the control, as evidenced by slightly reduced cytokine production following antigen stimulation. The levels of interferon gamma (IFN-γ), interleukin (IL)-2, IL-17A, IL-17F, and IL-22 in the supernatants from a co-culture of Psoriatic Human Epidermal Keratinocytes (PHEKs) and CD4+ lymphocytes (A), and IL-2, IL-10, and IL-17A in the supernatants from a co-culture of PHEKs and naïve CD4+ lymphocytes (B), measured from autologous, untreated psoriatic patients (UT), those subjected to topical treatment (TT), and those receiving biological treatment (BT). The keratinocytes were stimulated with IFN-γ (500 U/mL) for 24 h. Subsequently, ovalbumin (OVA) at 100 µg/mL was introduced as the antigen. After 24 h, the cultures were washed, and CD4+ lymphocytes were added for an additional 24 h. Cytokine production quantification was carried out using Luminex® assays. Comparisons yielding p-values less than 0.05 are presented. Statistical significance between groups (UT vs. TT and UT vs. BT) is indicated with asterisks (* p < 0.05, ** p < 0.01, *** p < 0.001). Numerical p-values are provided for comparisons within each group (before and after OVA stimulation). All experiments were conducted in biological replicates (n = 13), with n = 5 for UT, n = 4 for TT, and n = 4 for BT.

Similar articles

Cited by

References

    1. Abdallah F., Mijouin L., Pichon C. Skin Immune Landscape: Inside and Outside the Organism. Mediat. Inflamm. 2017;2017:5095293. doi: 10.1155/2017/5095293. - DOI - PMC - PubMed
    1. Nestle F.O., Di Meglio P., Qin J.Z., Nickoloff B.J. Skin immune sentinels in health and disease. Nat. Rev. Immunol. 2009;9:679–691. doi: 10.1038/nri2622. - DOI - PMC - PubMed
    1. Black A.P., Ardern-Jones M.R., Kasprowicz V., Bowness P., Jones L., Bailey A.S., Ogg G.S. Human keratinocyte induction of rapid effector function in antigen-specific memory CD4+ and CD8+ T cells. Eur. J. Immunol. 2007;37:1485–1493. doi: 10.1002/eji.200636915. - DOI - PubMed
    1. Orlik C., Berschneider K.M., Jahraus B., Niesler B., Balta E., Schäkel K., Schröder-Braunstein J., Souto-Carneiro M.M., Samstag Y. Keratinocyte-induced costimulation of human T cells through CD6—but not CD2—activates mTOR and prevents oxidative stress. Front. Immunol. 2022;13:1016112. doi: 10.3389/fimmu.2022.1016112. - DOI - PMC - PubMed
    1. Orlik C., Deibel D., Küblbeck J., Balta E., Ganskih S., Habicht J., Niesler B., Schröder-Braunstein J., Schäkel K., Wabnitz G., et al. Keratinocytes costimulate naive human T cells via CD2: A potential target to prevent the development of proinflammatory Th1 cells in the skin. Cell Mol. Immunol. 2020;17:380–394. doi: 10.1038/s41423-019-0261-x. - DOI - PMC - PubMed

MeSH terms

LinkOut - more resources