Review
. 2024 Dec 13;25(24):13398.
doi: 10.3390/ijms252413398.

Molecular Basis of Na, K-ATPase Regulation of Diseases: Hormone and FXYD2 Interactions

Affiliations
Review

Molecular Basis of Na, K-ATPase Regulation of Diseases: Hormone and FXYD2 Interactions

Bárbara Martins Cordeiro et al. Int J Mol Sci. .

Abstract

The Na, K-ATPase generates an asymmetric ion gradient that supports multiple cellular functions, including the control of cellular volume, neuronal excitability, secondary ionic transport, and the movement of molecules like amino acids and glucose. The intracellular and extracellular levels of Na+ and K+ ions are the classical local regulators of the enzyme's activity. Additionally, the regulation of Na, K-ATPase is a complex process that occurs at multiple levels, encompassing its total cellular content, subcellular distribution, and intrinsic activity. In this context, the enzyme serves as a regulatory target for hormones, either through direct actions or via signaling cascades triggered by hormone receptors. Notably, FXYDs small transmembrane proteins regulators of Na, K-ATPase serve as intermediaries linking hormonal signaling to enzymatic regulation at various levels. Specifically, members of the FXYD family, particularly FXYD1 and FXYD2, are that undergo phosphorylation by kinases activated through hormone receptor signaling, which subsequently influences their modulation of Na, K-ATPase activity. This review describes the effects of FXYD2, cardiotonic steroid signaling, and hormones such as angiotensin II, dopamine, insulin, and catecholamines on the regulation of Na, K-ATPase. Furthermore, this review highlights the implications of Na, K-ATPase in diseases such as hypertension, renal hypomagnesemia, and cancer.

Keywords: FXYD2; Na, K–ATPase; cancer; diseases; hormonal regulation; hypertension; ion transport; protein kinases; receptors; renal hypomagnesemia; signal transduction.


Conflict of interest statement

The authors declare no conflicts of interest.

Figures

Figure 1
Figure 1
Crystal structure of the Na, K–ATPase in the E1.Mg2+ state. Panels (A,B) show the Na, K–ATPase from pig kidney viewed from two orthogonal directions. The enzyme consists of a catalytic α-subunit (orange), a glycosylated β-subunit (maroon), and a regulatory FXYD protein, specifically FXYD2 (yellow), located behind the α-subunit. The α-subunit comprises three well-defined cytoplasmic domains (A-blue, N-red, and P-gray) and 10 transmembrane helices (M1–M10). The helices are not labeled with numbers. Panel (C) highlights residues (pink) in the M9 region of the α subunit that interact with the corresponding FXYD peptides and are important for forming a stable complex [13]. Panel (D) shows the RRNS motif of the Na, K–ATPase α1 isoform, where Ser936 is phosphorylated by PKA [13]. Protein Data Bank (PDB) ID: 8JBL.
Figure 2
Figure 2
Scheme of catalytic cycle of Na, K–ATPase. Panel (A,B) represent the simplified Post–Albers model [11] that outlines the process of ATP hydrolysis and ion transport by the Na, K–ATPase. This enzyme alternates between two conformations, E1 and E2. In the forward cycle (clockwise), the Na, K–ATPase first binds intracellular Na+ and MgATP with high affinity, forming the Na3E1ATP complex (Mg ions are not shown). The γ-phosphate of ATP is then transferred to the enzyme, and Na+ ions become occluded (represented by parentheses). The resulting (Na3)E1-PADP complex has a high-energy phosphate bond, making the reaction reversible. After ADP is released, Na+ ions are deoccluded and expelled into the extracellular space following or alongside the enzyme’s conformational shift in the enzyme to E2-P. This E2-P conformation also serves as the binding site for OUA, a well-known inhibitor of Na, K–ATPase. Extracellular K+ then binds to E2-P, promoting Pi release and K+ occlusion as they travel to the cytosol (protons, which are thought to bind to the “third Na+ site” with two K+ ions, are not shown). ATP, acting with low apparent affinity, accelerates K+ deocclusion and intracellular release. The enzyme then shifts back from E2 to E1 and is ready to begin the cycle again.
Figure 2
Figure 2
Scheme of catalytic cycle of Na, K–ATPase. Panel (A,B) represent the simplified Post–Albers model [11] that outlines the process of ATP hydrolysis and ion transport by the Na, K–ATPase. This enzyme alternates between two conformations, E1 and E2. In the forward cycle (clockwise), the Na, K–ATPase first binds intracellular Na+ and MgATP with high affinity, forming the Na3E1ATP complex (Mg ions are not shown). The γ-phosphate of ATP is then transferred to the enzyme, and Na+ ions become occluded (represented by parentheses). The resulting (Na3)E1-PADP complex has a high-energy phosphate bond, making the reaction reversible. After ADP is released, Na+ ions are deoccluded and expelled into the extracellular space following or alongside the enzyme’s conformational shift in the enzyme to E2-P. This E2-P conformation also serves as the binding site for OUA, a well-known inhibitor of Na, K–ATPase. Extracellular K+ then binds to E2-P, promoting Pi release and K+ occlusion as they travel to the cytosol (protons, which are thought to bind to the “third Na+ site” with two K+ ions, are not shown). ATP, acting with low apparent affinity, accelerates K+ deocclusion and intracellular release. The enzyme then shifts back from E2 to E1 and is ready to begin the cycle again.
Figure 3
Figure 3
Representation of the chemical structures of hormones that regulate Na, K–ATPase. The structures are represented as follows: Angiotensin II in green, dopamine in pink, epinephrine in yellow, norepinephrine in salmon, thyroxine in purple, and the three-dimensional structure of insulin (PDB: 1WAV). Oxygen atoms are shown in red, nitrogen atoms in blue, and iodine-123 in purple. The small molecule structures were obtained from ChemSpider, with CSIDs 150504, 661, 5611, 388394, and 64880242, respectively.
Figure 4
Figure 4
Ang II induces multiple signaling pathways that regulate Na, K–ATPase activity. In the adenylate cyclase–cAMP–PKA pathway, the phosphorylation of the α subunit by PKA inhibits Na, K–ATPase activity. Stimulatory effect of Ang II via the AT1R. The GRK4 increased phosphorylation of AT2R is associated with the inhibition of Na, K–ATPase. A signaling pathway involving PKC and the interaction of Na, K–ATPase with the adaptor protein 1 (AP1) recruits Na, K–ATPase molecules to the plasma membrane.
Figure 5
Figure 5
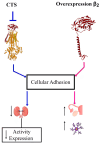
Schematic diagram of the role of Na, K–ATPase in cell adhesion in different cancer types. Blue line shows that Na+ pump inhibition by CTS reduces cell adhesion in renal cells, leading to decreased expression and enzymatic activity, which is linked to cancer progression. Pink line shows that the overexpression β2 isoform increased cellular adhesion on glia and ovary, arresting cancer progression.
Figure 6
Figure 6
Signaling pathways of Na, K–ATPase and their consequences in cancer. The inhibition of Na, K–ATPase by ouabain (red boxes) and the combined treatment with digoxin and cisplatin (green boxes) activate the Src/EGFR pathway, which leads to the activation of ERK and increased ROS production in mitochondria. This activates NF-κB, resulting in transcriptional regulation. EGFR phosphorylated activates the PKC pathway. Ouabain decreases the expression of alpha and beta subunits, while the combined treatment with digoxin and cisplatin has antitumoral effects. Solid arrows indicate experimentally supported events induced by inhibitors mentioned, while broken arrows indicate events with limited or indirect support.

References

    1. Dempski R.E., Lustig J., Friedrich T., Bamberg E. Structural Arrangement and Conformational Dynamics of the γ Subunit of the Na+/K+-ATPase. Biochemistry. 2008;47:257–266. doi: 10.1021/bi701799b. - DOI - PubMed
    1. Monti J.L.E., Montes M.R., Rossi R.C. Steady-State Analysis of Enzymes with Non-Michaelis-Menten Kinetics: The Transport Mechanism of Na+/K+-ATPase. J. Biol. Chem. 2018;293:1373–1385. doi: 10.1074/jbc.M117.799536. - DOI - PMC - PubMed
    1. Skou J.C. The Influence of Some Cations on an Adenosine Triphosphatase from Peripheral Nerves. Biochim. Biophys. Acta. 1957;23:394–401. doi: 10.1016/0006-3002(57)90343-8. - DOI - PubMed
    1. Quastel M.R., Kaplan J.G. Inhibition by Ouabain of Human Lymphocyte Transformation Induced by Phytohaemagglutinin In Vitro. Nature. 1968;219:198–200. doi: 10.1038/219198a0. - DOI - PubMed
    1. Boardman L., Huett M., Lamb J.F., Newton J.P., Polson J.M. Evidence for the Genetic Control of the Sodium Pump Density in HeLa Cells. J. Physiol. 1974;241:771–794. doi: 10.1113/jphysiol.1974.sp010684. - DOI - PMC - PubMed

LinkOut - more resources