

Integrating Single-Cell RNA-Seq and ATAC-Seq Analysis Reveals Uterine Cell Heterogeneity and Regulatory Networks Linked to Pimpled Eggs in Chickens
- PMID: 39769196
- PMCID: PMC11679886
- DOI: 10.3390/ijms252413431
Integrating Single-Cell RNA-Seq and ATAC-Seq Analysis Reveals Uterine Cell Heterogeneity and Regulatory Networks Linked to Pimpled Eggs in Chickens
Abstract
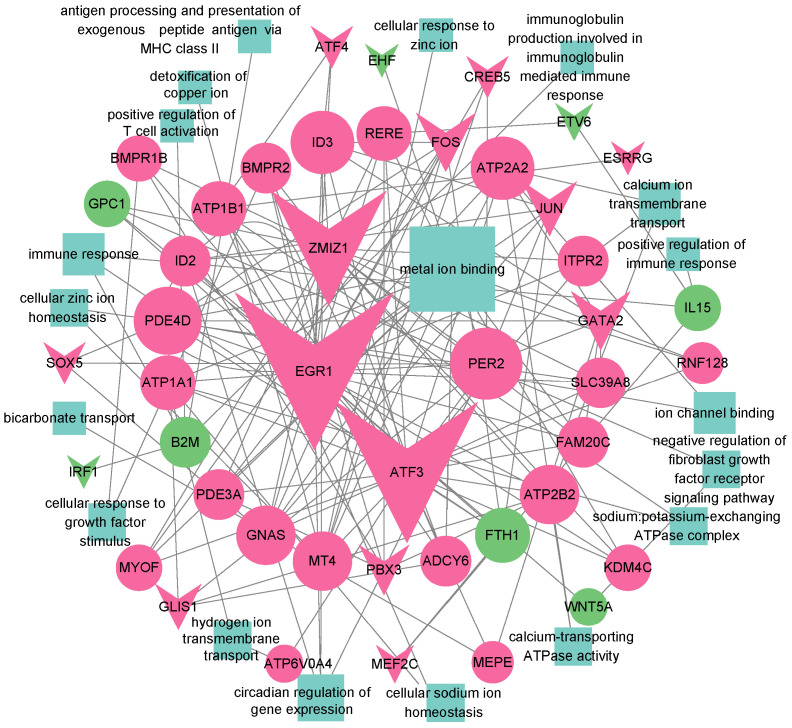
Pimpled eggs have defective shells, which severely impacts hatching rates and transportation safety. In this study, we constructed single-cell resolution transcriptomic and chromatin accessibility maps from uterine tissues of chickens using single-cell RNA sequencing (scRNA-seq) and single-cell ATAC sequencing (scATAC-seq). We identified 11 major cell types and characterized their marker genes, along with specific transcription factors (TFs) that determine cell fate. CellChat analysis showed that fibroblasts had the most extensive intercellular communication network and that the chickens laying pimpled eggs had amplified immune-related signaling pathways. Differential expression and enrichment analyses indicated that inflammation in pimpled egg-laying chickens may lead to disruptions in their circadian rhythm and changes in the expression of ion transport-related genes, which negatively impacts eggshell quality. We then integrated TF analysis to construct a regulatory network involving TF-target gene-Gene Ontology associations related to pimpled eggs. We found that the transcription factors ATF3, ATF4, JUN, and FOS regulate uterine activities upstream, while the downregulation of ion pumps and genes associated with metal ion binding directly promotes the formation of pimpled eggs. Finally, by integrating the results of scRNA-seq and scATAC-seq, we identified a rare cell type-ionocytes. Our study constructed single-cell resolution transcriptomic and chromatin accessibility maps of chicken uterine tissue and explored the molecular regulatory mechanisms underlying pimpled egg formation. Our findings provide deeper insights into the structure and function of the chicken uterus, as well as the molecular mechanisms of eggshell formation.
Keywords: chicken; pimpled egg; scATAC-seq; scRNA-seq; uterus.
Conflict of interest statement
The authors declare no conflict of interest.
Figures


Similar articles
-
Integrating proteomics and metabolomics to elucidate the regulatory mechanisms of pimpled egg production in chickens: Multi-omics analysis of the mechanism of pimpled egg formation.Poult Sci. 2025 Feb;104(2):104818. doi: 10.1016/j.psj.2025.104818. Epub 2025 Jan 15. Poult Sci. 2025. PMID: 39827695 Free PMC article.
-
Whole transcriptome sequencing reveals key genes and ceRNA regulatory networks associated with pimpled eggs in hens.Poult Sci. 2024 Jun;103(6):103715. doi: 10.1016/j.psj.2024.103715. Epub 2024 Apr 7. Poult Sci. 2024. PMID: 38652954 Free PMC article.
-
Single-cell insights: pioneering an integrated atlas of chromatin accessibility and transcriptomic landscapes in diabetic cardiomyopathy.Cardiovasc Diabetol. 2024 Apr 25;23(1):139. doi: 10.1186/s12933-024-02233-y. Cardiovasc Diabetol. 2024. PMID: 38664790 Free PMC article.
-
Application of computational algorithms for single-cell RNA-seq and ATAC-seq in neurodegenerative diseases.Brief Funct Genomics. 2025 Jan 15;24:elae044. doi: 10.1093/bfgp/elae044. Brief Funct Genomics. 2025. PMID: 39500613 Free PMC article. Review.
-
Research progress on bird eggshell quality defects: a review.Poult Sci. 2023 Jan;102(1):102283. doi: 10.1016/j.psj.2022.102283. Epub 2022 Oct 22. Poult Sci. 2023. PMID: 36399932 Free PMC article. Review.
Cited by
-
Mini review: Studying epigenomic alterations can shed light on coping and adaptive abilities during heat stress in monogastric livestock.Front Genet. 2025 Aug 1;16:1561804. doi: 10.3389/fgene.2025.1561804. eCollection 2025. Front Genet. 2025. PMID: 40822283 Free PMC article. Review.
References
MeSH terms
Substances
Grants and funding
LinkOut - more resources
Full Text Sources
Miscellaneous
