. 2024 Dec 15;25(24):13440.
doi: 10.3390/ijms252413440.

Apoptosis-Inducing and Proliferation-Inhibiting Effects of Doramectin on Mz-ChA-1 Human Cholangiocarcinoma Cells

Affiliations

Apoptosis-Inducing and Proliferation-Inhibiting Effects of Doramectin on Mz-ChA-1 Human Cholangiocarcinoma Cells

Yunfang Zhang et al. Int J Mol Sci. .

Abstract

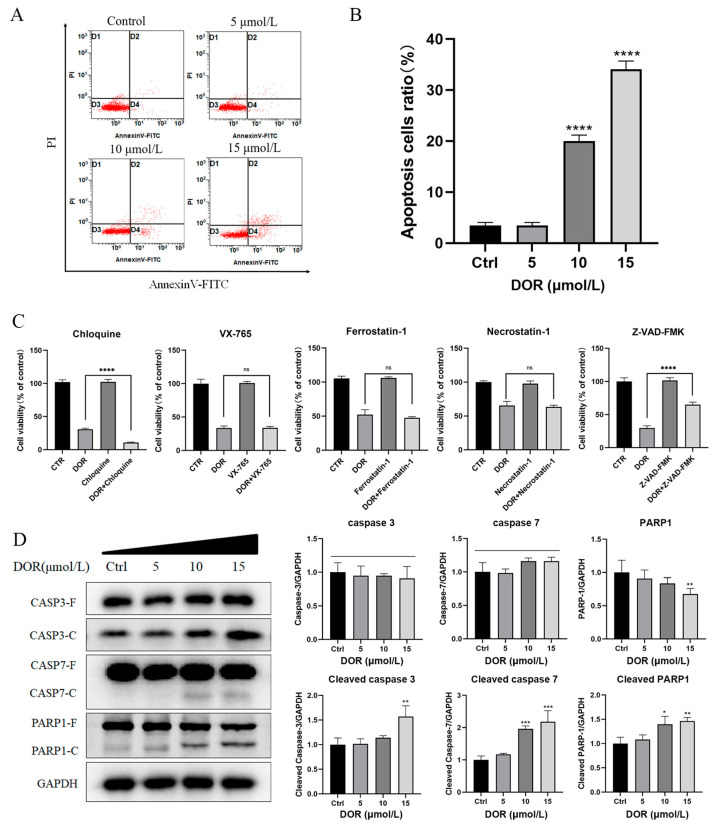
Cholangiocarcinoma is a malignant tumor that emerges in the intrahepatic or extrahepatic bile ducts. Doramectin (DOR), a third-generation derivative of avermectins (AVMs), is renowned for its low toxicity and high efficiency. However, no research has hitherto focused on the anti-cholangiocarcinoma effects of these drugs. In this study, we undertook a preliminary exploration of the mechanism through which DOR inhibits the viability of human cholangiocarcinoma cells (Mz-ChA-1) via transcriptome analysis and molecular validation at the cellular level. The results indicated that DOR could suppress the growth and proliferation of Mz-ChA-1 cells in a dose-dependent manner. Moreover, it significantly diminished their migration and invasion abilities. Cell cycle analysis disclosed arrest in the G1 phase, accompanied by an increase in p21 expression and a decrease in the levels of the cyclin E1 and CDK2 proteins. Additionally, DOR induced apoptosis via the ROS-triggered mitochondrial pathway. This was attested by an elevation in the BAX/BCL-2 ratio, the activation of caspase 3/7 and the cleavage of PARP1. These mechanistic insights underscore DOR's potential as a therapeutic agent against cholangiocarcinoma.

Keywords: Mz-ChA-1; apoptosis; doramectin; proliferation-inhibiting.


Conflict of interest statement

The authors declare no conflicts of interest.

Figures

Figure 1
Figure 1
DOR inhibits Mz-ChA-1 cell proliferation and cell migration capacity. (A) Mz-ChA-1 and QBC939 cells were treated with different doses of DOR for 24 h and 48 h, after which cell viability was determined via the CCK-8 assay. (B) Mz-ChA-1 cells were incubated with different doses of DOR for 48 h. Results show the cellular LDH release detected by the LDH assay kit. (C) Analysis of Mz-ChA-1 cell colonies by crystal violet staining after a 48 h exposure to varying concentrations of DOR. (D) Mz-ChA-1 cells were treated with different doses of DOR for 24 h. Giemsa staining was performed to observe the filling of scratches by the cells. The red line distinguishes the border between the two ends of the scratch. (E) Mz-ChA-1 cells were treated with different doses of DOR for 24 h. The Transwell assay shows the effect of DOR on cell invasion ability. Significance levels were categorized as: ns: not significant, ** p < 0.01 and **** p < 0.0001.
Figure 2
Figure 2
DOR inhibits G1/S phase transition in Mz-ChA-1 cells. (A) Bubble plot showing significantly changed signaling pathways enriched by KEGG enrichment analysis after DOR (15 μmol/L) treatment (n = 3). The red box highlights one of the pathways involved in DNA replication after KEGG enrichment analysis. (B) Bar line showing significantly changed cellular processes enriched by GO (gene ontology) enrichment analysis after DOR (15 μmol/L) treatment (n = 3). The red box highlights one of the GO enrichment results related to the cellular process of the G1/S phase transition. (C) Heatmap showing expression of cell cycle-related genes after DOR (15 μmol/L) treatment (n = 3). Red boxes highlight the expression of the CCNE1, CCNE2 and CDK2 genes (D) The cell cycle diagram shows the phases in which the major key enzymes perform their functions. The red box highlights the cell cycle period in which the cyclin E and CDK2 proteins are functioning.
Figure 3
Figure 3
DOR inhibits cyclin E1 and CDK2 gene expression in Mz-ChA-1 cells. (A,B) Mz-ChA-1 cells exposed to varying doses of DOR for 24 h were labeled with propidine iodide (PI) and detected by flow cytometry (n = 3). A representative cell cycle diagram is shown in (A). (C) Mz-ChA-1 cells were treated with varying doses of DOR for 24 h. The bar graph shows the transcription results of cell cycle-related genes (p21, CDK2, cyclin E1 and cyclin E2) detected by RT-qPCR. (D) Mz-ChA-1 cells were treated with varying doses of DOR for 24 h (n = 3). Western blot analysis delineated the expression profiles of cell cycle-regulatory proteins, including p21, cyclin E1 and CDK2. Significance levels were categorized as: * p < 0.05, ** p < 0.01, *** p < 0.001 and **** p < 0.0001.
Figure 4
Figure 4
DOR induces apoptosis in Mz-ChA-1 cells. (A,B) Mz-ChA-1 cells treated with DOR at varying concentrations for 48 h were subjected to Annexin V-FITC/PI staining, followed by flow cytometry analysis (n = 3). (A) illustrates a typical density plot from the Annexin V-FITC/PI staining. (C) Effect of DOR (10 μmol/L) on the proliferation of Mz-ChA-1 cells for 48 h after pretreatment with inhibitors. Inhibitors included: chloroquine (cellular autophagy inhibitor, 20 μM), VX-765 (specific inhibitor of caspase-1, 50 μM), ferrostatin-1 (iron death inhibitor, 0.5 μM), necrostatin-1 (necrotic pathway inhibitor, 30 μM) and Z-VAD-FMK (apoptosis pathway inhibitor, 20 μM). n = 4. (D) Mz-ChA-1 cells were treated with different doses of DOR for 24 h. Western blot analysis revealed the cleavage of apoptosis-related proteins. CASP3-F/C indicates caspase 3 full-length/cleavage protein; CASP7-F/C indicates caspase 7 full-length protein/cleavage protein; PARP1-F/C indicates PARP1 full-length protein/cleaved protein. Significance levels were categorized as: ns: not significant, p > 0.05, * p < 0.05, ** p < 0.01, *** p < 0.001 and **** p < 0.0001.
Figure 5
Figure 5
DOR inhibits the expression of the antiapoptotic protein BCL-2. (A) Fluorescence plot of mitochondrial transmembrane potential changes in Mz-ChA-1 cells after DOR action. Scale bar, 25μm. (B) Red-to-green fluorescence ratio (n = 3). (C) Changes in ROS in Mz-ChA-1 cells treated with different concentrations of DOR. (D) Mz-ChA-1 cells were treated with different doses of DOR for 24 h. The bar graph shows the transcription results of BAX, BCL-2 and their relative ratio detected by RT-qPCR. (E) Mz-ChA-1 cells were treated with different doses of DOR for 24 h. The results of Western blot show the expression of BAX and BCL-2. Significance levels were categorized as: * p < 0.05, ** p < 0.01, *** p < 0.001.
Figure 6
Figure 6
Overview of the mechanism of action of DOR.

Similar articles

References

    1. Vij M., Puri Y., Rammohan A., Gowripriya G., Rajalingam R., Kaliamoorthy I., Rela M. Pathological, molecular, and clinical characteristics of cholangiocarcinoma: A comprehensive review. World J. Gastrointest. Oncol. 2022;14:607–627. doi: 10.4251/wjgo.v14.i3.607. - DOI - PMC - PubMed
    1. Brindley P.J., Bachini M., Ilyas S.I., Khan S.A., Loukas A., Sirica A.E., Teh B.T., Wongkham S., Gores G.J. Cholangiocarcinoma. Nat. Rev. Dis. Primers. 2021;7:65. doi: 10.1038/s41572-021-00300-2. - DOI - PMC - PubMed
    1. Alsaleh M., Leftley Z., Barbera T.A., Sithithaworn P., Khuntikeo N., Loilome W., Yongvanit P., Cox I.J., Chamodol N., Syms R.R., et al. Cholangiocarcinoma: A guide for the nonspecialist. Int. J. Gen. Med. 2019;12:13–23. doi: 10.2147/IJGM.S186854. - DOI - PMC - PubMed
    1. Ilyas S.I., Khan S.A., Hallemeier C.L., Kelley R.K., Gores G.J. Cholangiocarcinoma—Evolving concepts and therapeutic strategies. Nat. Rev. Clin. Oncol. 2018;15:95–111. doi: 10.1038/nrclinonc.2017.157. - DOI - PMC - PubMed
    1. Doherty B., Nambudiri V.E., Palmer W.C. Update on the Diagnosis and Treatment of Cholangiocarcinoma. Curr. Gastroenterol. Rep. 2017;19:2. doi: 10.1007/s11894-017-0542-4. - DOI - PubMed

MeSH terms