. 2024 Dec 15;25(24):13448.
doi: 10.3390/ijms252413448.

Chronic Oxidative Stress and Stress Granule Formation in UBQLN2 ALS Neurons: Insights into Neuronal Degeneration and Potential Therapeutic Targets

Affiliations

Chronic Oxidative Stress and Stress Granule Formation in UBQLN2 ALS Neurons: Insights into Neuronal Degeneration and Potential Therapeutic Targets

Ao Gu et al. Int J Mol Sci. .

Abstract

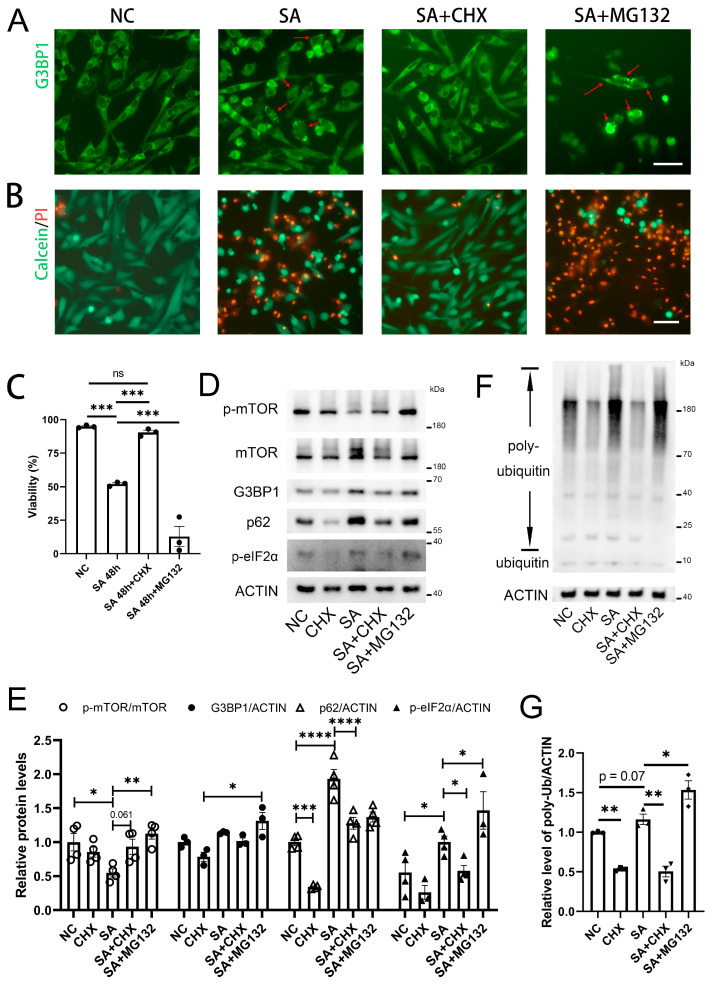
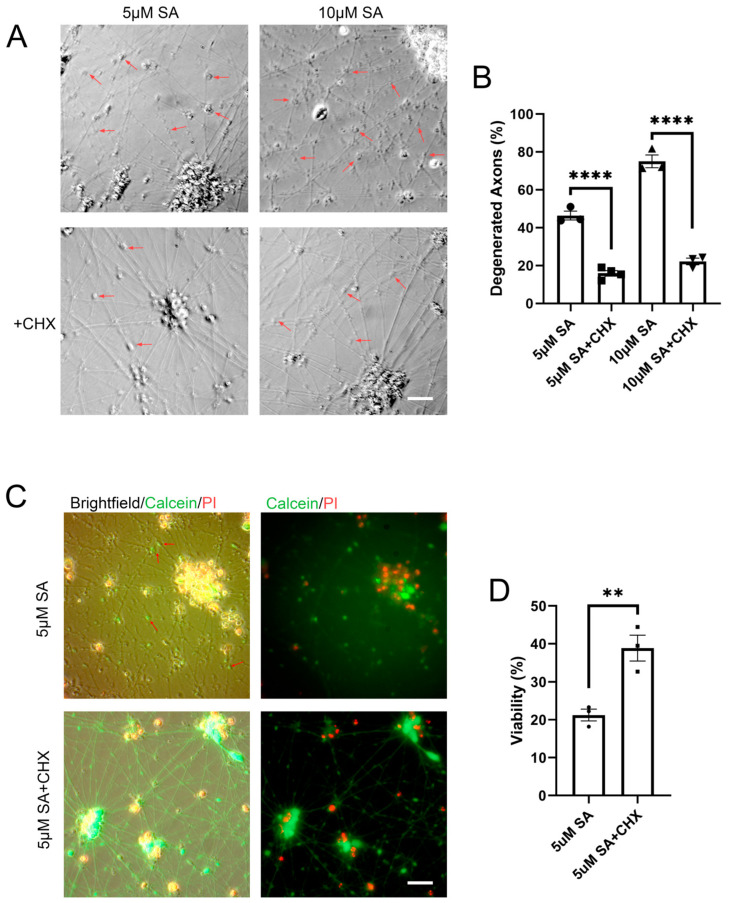
The pathogenesis of neurodegenerative diseases results from the interplay between genetic and environmental factors. Aging and chronic oxidative stress are critical contributors to neurodegeneration. UBQLN2, a ubiquitin-related protein, aids in protein degradation and protects against oxidative stress. In ALS neurons harboring UBQLN2 mutations, oxidative stress accelerates pathological changes, yet the precise mechanisms remain unclear. Using induced motor neurons (iMNs) derived from UBQLN2 P497H iPSCs, we observed ALS-like phenotypes, including TDP-43 mislocalization, increased cell death, and reduced viability. Sodium arsenite (SA)-induced oxidative stress triggered stress granule formation, while autophagy dysfunction exacerbated neuronal degeneration. CHX and bosutinib treatments reduced ubiquitinated protein accumulation and alleviated degeneration, highlighting potential therapeutic pathways. These findings emphasize the role of chronic oxidative stress and stress granule formation in UBQLN2 ALS, offering insights into novel therapeutic targets.

Keywords: ALS; UBQLN2; motor neurons; neurodegenerative diseases; oxidative stress; stress granule.


Conflict of interest statement

The authors declare no conflicts of interest.

Figures

Figure 1
Figure 1
Establishment and Characterization of P497H-NIL-iMN. (A) Schematic diagram of the differentiation principle: Dox induction of NIL gene expression drives the differentiation of NIL-iPSCs into NIL-iMNs; (B) P497H-NIL-iMN differentiation process: representative images from day 0, day 1, day 3, and day 7. Scale bar: 100 μm; (C) immunofluorescence detection of motor neuron markers in P497H-NIL-iMNs: cells at day 4 of differentiation were stained with anti-HB9, SMI32, and CHAT antibodies. Scale bar: 100 μm; (D) dynamic expression of motor neuron markers HB9 and CHAT in P497H-NIL-iMNs (n = 3): expression levels were measured in iPSCs/iMNs at day 0 (before Dox induction), and at days 2, 14, and 21 after differentiation. Data are means ± SEM. ** p < 0.01, *** p < 0.001. Statistics by one-way analysis of variance (ANOVA).
Figure 2
Figure 2
ALS-Related pathology in UBQLN2 mutant motor neurons. (A) Immunofluorescence analysis of TDP-43 localization in day 14 iMNs: under physiological conditions, TDP-43 is localized in the nucleus, while pathological conditions show TDP-43 mislocalization to the cytoplasm. Arrows indicate TDP-43 mislocalization in P497H-NIL-iMNs. Scale bar: 50 μm; (B,C) representative images and statistical analysis of neuronal soma size in WT-iMN2 and P497H-iMN at day 21 of differentiation (n > 25). Scale bar: 100 μm; (D,E) Calcein/PI analysis of cell viability in WT-iMN2 and P497H-iMN (n = 3): Calcein AM generates strong green fluorescence in live cells containing esterases, while PI stains the nuclei of cells with compromised membrane integrity. Scale bar: 100 μm; (F) ATP cell viability analysis of iMNs at days 14 and 7 (n ≥ 5): iMNs were differentiated in two 96-well plates, and ATP levels were measured at days 7 and 14 to assess the rate of decline in cell viability; (G) LDH release rate analysis: media and cell lysates from WT-iMN2 and P497H-iMN were collected at the indicated time points after complete media replacement 3 days prior, and LDH release rates were calculated (n ≥ 5). Data are means ± SEM. ns means “no significance”, * p < 0.05, ** p < 0.01, *** p < 0.001. Statistics by Mann–Whitney tests in (C), Student’s t tests in (E,G), and one-way ANOVA in (F).
Figure 3
Figure 3
Oxidative stress and neuropathology in P497H-iMNs. (A,B) Examination of axonal damage in P497H-iMNs: iMN morphology was recorded on day 14 using microscopy. Arrows indicate axonal swelling. Scale bar: 20 μm. Quantification of axonal swelling was performed by counting the number of swollen vesicles per 100 µm of axon across at least 3 fields, with a minimum of 5 axonal segments per field. (C) ROS levels in iMNs were measured using DCFH-DA, with at least 4 replicates per group. (D,E) Western blot analysis of p-eIF2α levels in iMN day 14 lysates, with quantification (n = 3). (F,G) Immunofluorescence detection and quantification of stress granules (SGs) in iMNs: cells were treated with 0.5 mM sodium arsenite (SA) for 45 min, and SGs were detected using G3BP1 as a marker. Scale bar: 10 μm. (H) Assessment of chronic oxidative stress on axonal pathology: iMNs were treated with varying concentrations of SA on day 7. Axon morphology was recorded after 48 h using light microscopy. Arrows indicate axonal swelling/fragmentation. Scale bar: 50 μm. Data are means ± SEM. ** p < 0.01, *** p < 0.001. Statistics by Student’s t test in (B,E,G) and one-way ANOVA in (C).
Figure 4
Figure 4
Impaired axonal lysosomal transport in neurons due to oxidative stress and UBQLN2 mutation. (A) Lysosomal labeling using LysoTracker-Red: maximum intensity projection visualized organelle movement trajectories within axons. Continuous, long trajectories indicate moving lysosomes, while discrete points highlight stationary organelles. Scale bar: 10 μm; (B) kymograph analysis to establish space-time plots: inclined lines represent moving lysosomes, and vertical lines indicate stationary organelles. Scale bar: 10 μm; (C) statistical analysis of the proportion of motile lysosomes in motor neurons: lysosomal movement in axons was quantified, with vesicles moving more than 20 μm during the observation period defined as motile lysosomes. At least 5 fields per group were analyzed, with vesicle count n > 250. Data are means ± SEM. ** p < 0.01. Statistics by one-way ANOVA.
Figure 5
Figure 5
CHX inhibits SGs and cell death in HeLa cells. (A) HeLa cells expressing G3BP1-GFP were subjected to chronic oxidative stress induced by 20 μM SA and treated with 5 μM CHX and 5 μM MG132. G3BP1 aggregation indicating SGs was detected by fluorescence microscopy 48 h later. Arrows indicate SG-positive cells. Scale bar: 100 μm; (B,C) Calcein/PI analysis of cell viability in HeLa cells under the same treatment conditions, with statistical analysis of the results (n = 3). Scale bar: 20 μm; (D,E) Western blot analysis of HeLa cell lysates under the same treatment conditions (n ≥ 3); (F,G) Western blot and statistical analysis of poly-ubiquitin levels (n = 3). Data are means ± SEM. * p < 0.05, ** p < 0.01, *** p < 0.001, **** p < 0.0001; ns, nonsignificant. Statistics by one-way ANOVA in (C,G) and two-way ANOVA in (E).
Figure 6
Figure 6
CHX rescues motor neuron degeneration. (A,B) iMNs at day 11 were treated with different concentrations of SA to induce oxidative stress, followed by treatment with 5 μM CHX. Neuronal morphology was examined 48 h later, and the ratio of degenerated axons was statistically analyzed (n ≥ 3). Scale bar: 25 μm; (C,D) Calcein/PI analysis of cell viability in iMNs 72 h after the same treatment, with statistical analysis (n = 3). Arrows indicate axonal degeneration. Scale bar: 25 μm. Data are means ± SEM. ** p < 0.01, **** p < 0.0001. Statistics by one-way ANOVA in (B), and Student’s t test in (D).
Figure 7
Figure 7
Effects of CHX and bosutinib on cell viability. (A) iMNs at day 7 were treated with 1 μM CHX and 1 μM bosutinib, and Calcein/PI analysis was performed and imaged at day 14. Scale bar: 100 μm; (B) statistical analysis of the Calcein/PI results (n = 4). Data are means ± SEM. * p < 0.05. Statistics by Student’s t test and one-way ANOVA in (B).
Figure 8
Figure 8
CHX and bosutinib alleviate ubiquitinated protein accumulation in iMN. (A) Western blot analysis of iMNs (n = 3). iMNs at day 7 were treated with 1 μM CHX or 1 μM bosutinib for 24 h, or 10 μM MG132 for 2 h. Data are means ± SEM. * p < 0.05, ** p < 0.01. Statistics by Student’s t test and one-way ANOVA. (B) Western blot analysis of iPSCs. The WT-iPSC and P497H-iPSC lines were derived as described earlier. The UBQLN2-KO line was generated by knocking out UBQLN2 in WT-iPSCs using CRISPR technology, and the clones were validated by sequencing and Western blot analysis. (C) Potential pathways of UBQLN2 and oxidative stress involvement in neuropathology.

Similar articles

References

    1. Trabjerg B.B., Garton F.C., van Rheenen W., Fang F., Henderson R.D., Mortensen P.B., Agerbo E., Wray N.R. ALS in Danish Registries: Heritability and links to psychiatric and cardiovascular disorders. Neurol. Genet. 2020;6:e398. doi: 10.1212/NXG.0000000000000398. - DOI - PMC - PubMed
    1. Ingre C., Roos P.M., Piehl F., Kamel F., Fang F. Risk factors for amyotrophic lateral sclerosis. Clin. Epidemiol. 2015;7:181–193. doi: 10.2147/CLEP.S37505. - DOI - PMC - PubMed
    1. Belbasis L., Bellou V., Evangelou E. Environmental Risk Factors and Amyotrophic Lateral Sclerosis: An Umbrella Review and Critical Assessment of Current Evidence from Systematic Reviews and Meta-Analyses of Observational Studies. Neuroepidemiology. 2016;46:96–105. doi: 10.1159/000443146. - DOI - PubMed
    1. Chia R., Chio A., Traynor B.J. Novel genes associated with amyotrophic lateral sclerosis: Diagnostic and clinical implications. Lancet Neurol. 2018;17:94–102. doi: 10.1016/S1474-4422(17)30401-5. - DOI - PMC - PubMed
    1. Deng H.X., Hentati A., Tainer J.A., Iqbal Z., Cayabyab A., Hung W.Y., Getzoff E.D., Hu P., Herzfeldt B., Roos R.P., et al. Amyotrophic lateral sclerosis and structural defects in Cu,Zn superoxide dismutase. Science. 1993;261:1047–1051. doi: 10.1126/science.8351519. - DOI - PubMed

MeSH terms

LinkOut - more resources