. 2024 Dec 16;25(24):13459.
doi: 10.3390/ijms252413459.

Host-Parasite Interactions in Toxoplasma gondii-Infected Cells: Roles of Mitochondria, Microtubules, and the Parasitophorous Vacuole

Affiliations

Host-Parasite Interactions in Toxoplasma gondii-Infected Cells: Roles of Mitochondria, Microtubules, and the Parasitophorous Vacuole

Sailen Barik et al. Int J Mol Sci. .

Abstract

An intracellular protozoan, the Apicomplexan parasite Toxoplasma gondii (T. gondii) infects nucleated cells, in which it triggers the formation of a specialized membrane-confined cytoplasmic vacuole, named the parasitophorous vacuole (PV). One of the most prominent events in the parasite's intracellular life is the congregation of the host cell mitochondria around the PV. However, the significance of this event has remained largely unsolved since the parasite itself possesses a functional mitochondrion, which is essential for its replication. Here, we explore several fundamental aspects of the interaction between the PV and the host cell mitochondria. They include the detailed features of the congregation, the nature and mechanism of the mitochondrial travel to the PV, and the potential significance of the migration and congregation. Using a combination of biochemical assays, high-resolution imaging, and RNAi-mediated knockdown, we show that: (i) mitochondrial travel to the PV starts very early in parasite infection, as soon as the smallest PV takes shape; (ii) the travel utilizes the contractile microtubular network of the host cell; and (iii) near the end of the parasitic life cycle, when most PVs have reached their largest sustainable size and are about to lyse in order to release the progeny parasites, the associated mitochondria change their usual elongated shape to small spheres, apparently resulting from increased fission. Intriguingly, despite the well-known mitochondrial role as a major producer of cellular ATP, the parasite does not seem to use cellular mitochondrial ATP. Together, these findings may serve as foundations for future research in host-parasite interaction, particularly in the elucidation of its mechanisms, and the possible development of novel antiparasitic drug regimens.

Keywords: Apicomplexa; Toxoplasma; energy metabolism; microtubule; mitochondria; protozoa.


Conflict of interest statement

This work formed part of a thesis of Joel Andrews, submitted in 2010 to the Graduate Faculty of the University of South Alabama in partial fulfillment of Doctor of Philosophy (Ph.D.) in Basic Medical Sciences (Mentor: Sailen Barik, Chair of the Dissertation Committee). The authors declare no conflicts of interest.

Figures

Figure 1
Figure 1
Congregation of mitochondria around the T. gondii parasitophorous vacuole (PV). Human foreskin fibroblasts (HFF) cells, grown in monolayer, were infected with recombinant T. gondii RH strain expressing Green Fluorescent Protein (GFP-Tg). Twenty-four hours after infection, the cells were stained and examined by fluorescence microscopy in a Nikon TE-2000E inverted fluorescent microscope as described in Materials and Methods. (A) Red = Mitochondria stained by Mitotracker Red 580; Green = GFP-expressing tachyzoites; (B) the same field as in (A), but shown without the green channel so that the PV contours can be seen more clearly. Dotted circles indicate the location of PVs. As seen, the PVs contain differing numbers of tachyzoites; the two PVs containing eight tachyzoites exhibit the characteristic rosette pattern; of these, the one on the right is tilted axially towards the viewer so that not all tachyzoites are clearly visible.
Figure 2
Figure 2
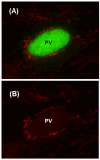
Mitochondrial alterations at the late stage of PV. About two-and-a-half days (60 h) after infection with GFP-Tg, the cells were stained with Mitotracker Red 580, and the image was captured as described in Figure 1. Note that the exact number of hours elapsed before the mitochondrial rounding is observed can vary between experiments due to small differences in variables such as the health of the inoculum, the confluency of the monolayer, and media freshness. In both (panels A,B), PV = Parasitophorous vacuole; mitochondria associated with the PV are small and rounded compared to those at earlier stages of infection (as in Figure 1). (Panel B) represents the same field as in (panel A), but without the green channel.
Figure 3
Figure 3
Slower growth rate of T. gondii in cells that are deficient in oxidative ATP synthesis. C4T or C4Taav cells were infected with GFP-Tg, and parasite replication was measured by quantification of green fluorescence as described in Materials and Methods. Relative fluorescence units at different times post-infection are plotted. C4T = Blue line; C4Taav = Red line. The results are the mean of three independent experiments, with error bars as shown.
Figure 4
Figure 4
No visual difference in mitochondrial congregation with the PV between C4T or C4Taav cells. Green = GFP-Tg; Red = Mitochondria stained with Mitotracker 580. Only a few representative images are shown.
Figure 5
Figure 5
C4T (panels A,B) or C4Taav cells (panels C,D) were infected with GFP-Toxoplasma over a time course, and images of multiple fields were captured, two of which are presented here (Top half of this Figure). Because the tachyzoite number per PV increases two-fold every division, tachyzoite numbers can be reliably estimated based on PV size, so low-magnification images were collected to estimate the distribution of tachyzoite number per PV. Each green cluster represents a PV. (A,C) = brightfield image; (B,D) = fluorescence. A total of ~300 PVs were randomly chosen in each cell line, and the number of PVs in each size class was counted and plotted in bar graphs (Bottom half of this Figure) as a fraction of the total PVs counted.
Figure 6
Figure 6
T. gondii-infected HFF cells at 24 h post-infection were stained with fluorescent marker dyes as described in the text and Materials and Methods and imaged live. (AC) = Fluorescence images; (D) = DIC brightfield. (A) = Red only (Mitochondria); (B) = Green only (Microtubules); (C) = Merged image combined with nuclear staining by Hoechst 333342 (N). The parasites in this image are not fluorescently labeled but can be made out in the brightfield, in which the single PV, housing 8 tachyzoites, is circled for easy viewing.
Figure 7
Figure 7
Toxoplasma-induced mitochondrial migration (TIMM). This set of images recorded the real-time movement of a mitochondrion to the parasite in an early-stage PV during the first hours of infection. HFF cells were infected with GFP-Tg and incubated for two hours. Cells were then stained with Mitotracker 580 and examined by live fluorescence video microscopy; frames were collected at 15 s intervals for 5 min, and representative selections are presented in the time sequence (A) → (B) → (C) → (D). Mitochondrial projections reaching towards a PV containing a single tachyzoite are indicated by the white arrowheads and followed through the time frames. Spectral leakage into the red channel from the GFP allows the tachyzoite to be visualized with the same microscope settings, facilitating rapid video microscopy. In frame (B), the projection from a mitochondrion attaches to the PVM and apparently remains bound. Over frame (C,D), the rest of the mitochondrion appears to be gradually reeled in and distributed along the PVM. The progressive fading of the mitochondrial stain from (A) to (D) is due to photo-bleaching from the frequent illumination needed for videography.
Figure 8
Figure 8
Time-lapse microscopy of infected HFF cells demonstrating a curvilinear approach of mitochondria to the PVM. Infection and imaging were performed, as in Figure 7. The frames were collected at intervals of 15 s for 5 min. In the sequence (AD), a mitochondrion (indicated by white arrowheads) can be seen to approach and associate with the PVM. In the first image (Panel A). the mitochondrion is barely visible and then follows an altered path (Panel B), which brings it into a different plane of focus (Panel C). Finally, it appears to make contact with the PVM and become bound (Panel D).
Figure 9
Figure 9
Confirmation of the specificity of the EB1 antibody. HFF cells were infected with Tg RH as described before, and 24 h later, the cells were fixed and examined by secondary (indirect) immunofluorescence microscopy. (Panel A) = Overlay image of nuclear (N) DNA in blue (DAPI), EB1 in red (anti-EB1 primary antibody, Alexafluor 594 secondary antibody), and microtubules in green (anti-tubulin primary antibody, Alexafluor 488 secondary antibody). (Panel B) = Red (EB1) only. Due to the high conservation of tubulin sequences through phylogeny, the antibody to human tubulin cross-reacts with T. gondii tubulin, which is visible in the parasite subpellicular and spindle regions, as evidenced by the strong green color of the parasite cells inside the PV.
Figure 10
Figure 10
Depolymerization and recovery of host microtubules reveal nucleation of novel microtubules at or near the PVM. Human foreskin fibroblasts (HFF) were infected with RH T. gondii. Twenty-four hours after infection, HFF cells were placed at 4 °C for 45 min to depolymerize microtubules and then placed at room temperature and fixed in methanol at intervals. (Panels A,B) show an infected cell fixed immediately after cold treatment, demonstrating depolymerization of microtubules stained with anti-tubulin (green) and anti-EB1 (red) antibodies, and DNA stained by DAPI (blue). (Panel A) shows a merged image of all three channels, while (B) shows tubulin alone. The arrow indicates cold-resistant microtubule staining in Tg tachyzoites. To focus exclusively on host microtubules, cells in (panels C,D) were assayed by immunofluorescence microscopy against human EB1 (green), and co-stained with DAPI (blue). (Panels C,D) are representative images of infected cells at 4 min post-release from 4 °C, and the arrows indicate nascent human microtubules forming at or near the PVM. The positive staining located near the host nucleus represents the outgrowth of EB1-bound microtubules from the microtubule organizing center (MTOC).
Figure 11
Figure 11
Human foreskin fibroblasts (HFF) were infected with the T. gondii RH strain and then fixed and examined by immunofluorescence microscopy against acetylated tubulin (anti-acetylated α-tubulin primary antibody and Alexafluor 488 secondary antibody). Both the early-stage (panels A,B) and the late-stage (C,D) infections show a prominent staining of the tachyzoites for acetylated tubulin. Panels on the left show a merged overlay of DAPI (blue), acetylated tubulin (green) and DIC brightfield images; panels on the right show green fluorescence alone. Interestingly, in early infection (A,B), a subpopulation of HFF microtubules is acetylated, but by late infection (C,D), the host microtubule cytoskeleton is no longer intact, and no staining of host microtubules is observed.
Figure 12
Figure 12
Dose-dependent inhibition of Tg growth by the microtubule depolymerizing agent, nocodazole. HFF cells were grown in 96-well plates, treated with the indicated concentrations of nocodazole for 2 h, and then infected with GFP-Tg. Total GFP fluorescence was measured for each well at intervals of 12 h, as described under Materials and Methods (Section 6.3), and plotted in relative fluorescence units as shown. The standard error bars are derived from three experiments; where the error is very small, the bars are not visible due to being smaller than the symbols indicating the dose.
Figure 13
Figure 13
Inhibition of PV–mitochondria association (PVMA) by the microtubule depolymerizing agent, nocodazole. HFF cells were grown in 96-well plates, treated with the indicated concentrations of nocodazole for 2 h, and then infected with GFP-Tg. Twenty-four hours after infection, the cells were stained with Mitotracker 580, and a quantitative assay of PVMA was performed as described (Section 6.5). The numbers were plotted as a percentage of the PVMA in untreated (U) cells. We performed the assay with a range of nocodazole concentrations, but for the sake of brevity, only the result with the highest concentration of the drug used in Figure 12 (33 μM) is shown. The standard error bars are derived from three experiments.
Figure 14
Figure 14
Loss of DCTN2 (dynamitin) inhibits T. gondii growth. siRNA transfection is described in Materials and Methods. We used two concentrations of siRNA as shown, viz. 20 nM and 100 nM siRNA. In the ‘no-siRNA’ control (0 nM siRNA), sterile buffer replaced siRNA in the transfection mix. (A) At 36 h after transfection, the total RNA of the cells was subjected to a quantitative reverse transcription-polymerase chain reaction (qRT-PCR) using the SYBR Green-based assay from Bio-Rad (as described in Section 6), and the CT values, normalized against GAPDH CT, were plotted. Each bar represents the mean of three CT measurements, with the standard error as shown. The CT values of the three measurements (as plotted here) were: 0 nM = 27.5, 27.6, 26.8; 10 nM = 28.8, 28.4, 29.1; 100 nM = 30.3, 31.1, 30.5. (B) In parallel wells, the transfected cells were infected with GFP-Tg; total fluorescence was measured for each well at 8–20 h intervals, and relative fluorescence values were plotted. Standard error bars from triplicate experiments are also shown; where the error is very small, the bars are not displayed in order to avoid cluttering.
Figure 15
Figure 15
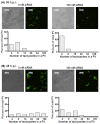
HFF cells were transfected with 0 or 100 nM of DCTN2 siRNA and 36 h later infected with GFP-Tg, as described in Figure 13. The cells were followed with time, and images were captured at the indicated times (36 h, 48 h, 60 h, and 72 h post-infection), respectively, in (panels AD). In each pair (e.g., A1,A2 pair, or A3,A4 pair), the phase-contrast image is on the left and the fluorescence image, is on the right. PVs were binned for the number of tachyzoites they contain (four, six, eight etc., as shown), and their numbers were expressed as percent of total PV counted, as also described in Figure 5.
Figure 15
Figure 15
HFF cells were transfected with 0 or 100 nM of DCTN2 siRNA and 36 h later infected with GFP-Tg, as described in Figure 13. The cells were followed with time, and images were captured at the indicated times (36 h, 48 h, 60 h, and 72 h post-infection), respectively, in (panels AD). In each pair (e.g., A1,A2 pair, or A3,A4 pair), the phase-contrast image is on the left and the fluorescence image, is on the right. PVs were binned for the number of tachyzoites they contain (four, six, eight etc., as shown), and their numbers were expressed as percent of total PV counted, as also described in Figure 5.
Figure 16
Figure 16
Schematic representation of our workflow for quantifying relative PVMA.

Similar articles

References

    1. Ben-Harari R.R., Connolly M.P. High burden and low awareness of toxoplasmosis in the United States. Postgrad. Med. 2019;131:103–108. doi: 10.1080/00325481.2019.1568792. - DOI - PubMed
    1. Montoya J.G., Liesenfeld O. Toxoplasmosis. Lancet. 2004;363:1965–1976. doi: 10.1016/S0140-6736(04)16412-X. - DOI - PubMed
    1. Weiss L.M., Dubey J.P. Toxoplasmosis: A history of clinical observations. Int. J. Parasitol. 2009;39:895–901. doi: 10.1016/j.ijpara.2009.02.004. - DOI - PMC - PubMed
    1. Murata Y., Sugi T., Weiss L.M., Kato K. Identification of compounds that suppress Toxoplasma gondii tachyzoites and bradyzoites. PLoS ONE. 2017;12:e0178203. doi: 10.1371/journal.pone.0178203. - DOI - PMC - PubMed
    1. Gendrin C., Mercier C., Braun L., Musset K., Dubremetz J.-F., Cesbron-Delauw M.-F. Toxoplasma gondii uses unusual sorting mechanisms to deliver transmembrane proteins into the host-cell vacuole. Traffic. 2008;9:1665–1680. doi: 10.1111/j.1600-0854.2008.00793.x. - DOI - PubMed

LinkOut - more resources