. 2024 Dec 16;25(24):13465.
doi: 10.3390/ijms252413465.

Characterisation of the Plasma and Faecal Metabolomes in Participants with Functional Gastrointestinal Disorders

Affiliations

Characterisation of the Plasma and Faecal Metabolomes in Participants with Functional Gastrointestinal Disorders

Karl Fraser et al. Int J Mol Sci. .

Abstract

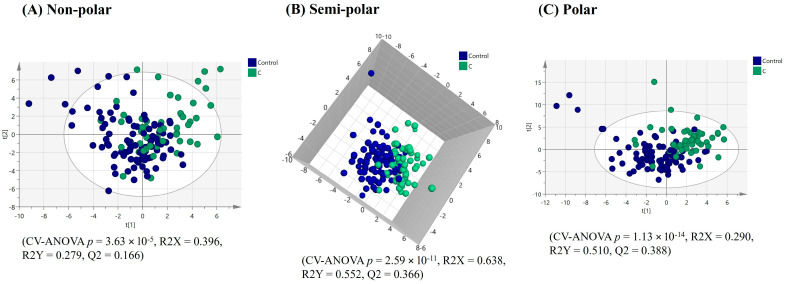
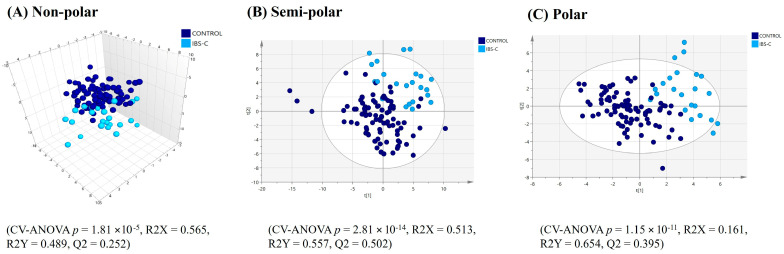
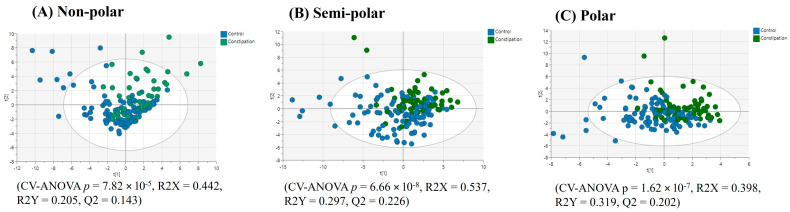
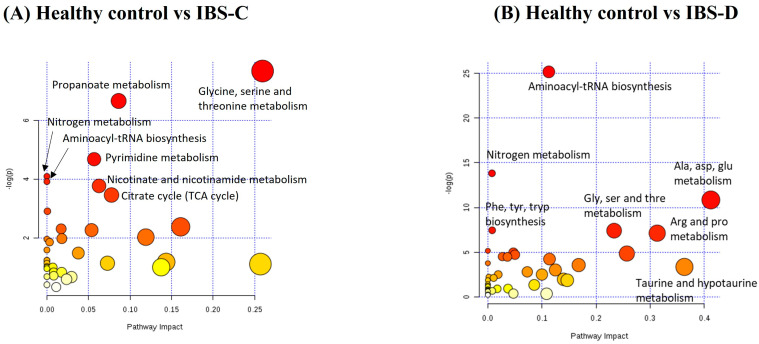
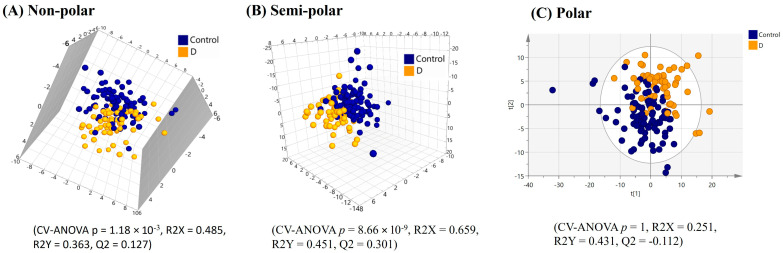
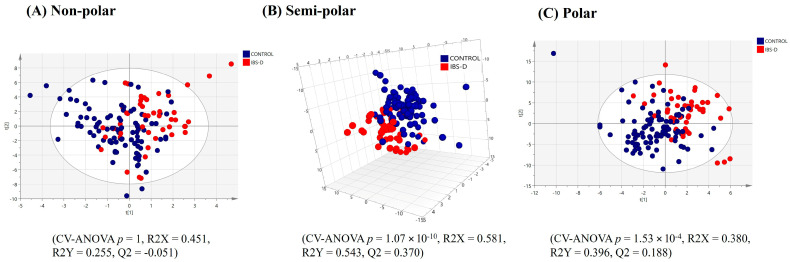
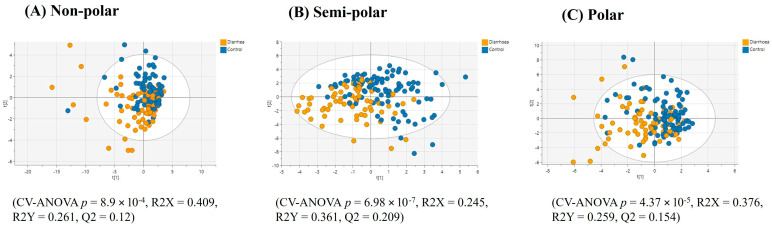
There is evidence of perturbed microbial and host processes in the gastrointestinal tract of individuals with functional gastrointestinal disorders (FGID) compared to healthy controls. The faecal metabolome provides insight into the metabolic processes localised to the intestinal tract, while the plasma metabolome highlights the overall perturbances of host and/or microbial responses. This study profiled the faecal (n = 221) and plasma (n = 206) metabolomes of individuals with functional constipation (FC), constipation-predominant irritable bowel syndrome (IBS-C), functional diarrhoea (FD), diarrhoea-predominant IBS (IBS-D) and healthy controls (identified using the Rome Criteria IV) using multimodal LC-MS technologies. Discriminant analysis separated patients with the 'all constipation' group (FC and IBS-C) from the healthy control group and 'all diarrhoea' group (FD and IBS-D) from the healthy control group in both sample types. In plasma, almost all multimodal metabolite analyses separated the 'all constipation' or 'all diarrhoea' group from the healthy controls, and the IBS-C or IBS-D group from the healthy control group. Plasma phospholipids and metabolites linked to several amino acid and nucleoside pathways differed (p < 0.05) between healthy controls and IBS-C. In contrast, metabolites involved in bile acid and amino acid metabolism were the key differentiating classes in the plasma of subjects with IBS-D from healthy controls. Faecal lipids, particularly ceramides, diglycerides, and triglycerides, varied (p < 0.05) between healthy controls and the 'all constipation' group and between healthy controls and 'all diarrhoea' group. The faecal and plasma metabolomes showed perturbations between constipation, diarrhoea and healthy control groups that may reflect processes and mechanisms linked to FGIDs.

Keywords: LC-MS; biomarkers; constipation; diarrhoea; gut-brain; metabolomics.


Conflict of interest statement

The authors declare no conflict of interest.

Figures

Figure 1
Figure 1
PLS-DA score plots of plasma multimodal metabolomics ((A) non-polar, (B) semi-polar and (C) polar metabolite) analyses for ‘all constipation’ compared to the healthy control group.
Figure 2
Figure 2
PLS-DA score plots of plasma multimodal metabolomics ((A) non-polar, (B) semi-polar and (C) polar metabolite) analyses for IBS constipation compared to the healthy control group.
Figure 3
Figure 3
PLS-DA score plots of faecal multimodal metabolomics ((A) non-polar, (B) semi-polar and (C) polar metabolite) analyses for ‘all constipation’ compared to the healthy control group.
Figure 4
Figure 4
Metabolite set enrichment analysis for key differential polar and semi-polar metabolites measured in plasma for (A) IBS constipation compared to the healthy control group and (B) IBS diarrhoea compared to the healthy control group.
Figure 5
Figure 5
PLS-DA score plots of plasma multimodal metabolomics ((A) non-polar, (B) semi-polar and (C) polar metabolite) analyses for ‘all diarrhoea’ compared to the healthy control group.
Figure 6
Figure 6
PLS-DA score plots of plasma multimodal metabolomics ((A) non-polar, (B) semi-polar and (C) polar metabolite) analyses for IBS diarrhoea compared to the healthy control group.
Figure 7
Figure 7
PLS-DA score plots of faecal multimodal metabolomics ((A) non-polar, (B) semi-polar and (C) polar metabolite) analyses for ‘all diarrhoea’ group compared to the healthy control group.

Similar articles

Cited by

References

    1. Drossman D.A., Tack J. Rome Foundation Clinical Diagnostic Criteria for Disorders of Gut-Brain Interaction. Gastroenterology. 2022;162:675–679. doi: 10.1053/j.gastro.2021.11.019. - DOI - PubMed
    1. Grad S., Dumitrascu D.L. Irritable Bowel Syndrome Subtypes: New Names for Old Medical Conditions. Dig. Dis. 2020;38:122–127. doi: 10.1159/000505287. - DOI - PubMed
    1. Black C.J., Ford A.C. Global Burden of Irritable Bowel Syndrome: Trends, Predictions and Risk Factors. Nat. Rev. Gastroenterol. Hepatol. 2020;17:473–486. doi: 10.1038/s41575-020-0286-8. - DOI - PubMed
    1. Enck P., Aziz Q., Barbara G., Farmer A.D., Fukudo S., Mayer E.A., Niesler B., Quigley E.M., Rajilic-Stojanovic M., Schemann M., et al. Irritable bowel syndrome. Nat. Rev. Dis. Primers. 2016;2:16014. doi: 10.1038/nrdp.2016.14. - DOI - PMC - PubMed
    1. Bennet S.M., Keshteli A.H., Bercik P., Madsen K.L., Reed D., Vanner S.J. Application of Metabolomics to the Study of Irritable Bowel Syndrome. Neurogastroenterol. Motil. 2020;32:e13884. doi: 10.1111/nmo.13884. - DOI - PubMed

LinkOut - more resources