. 2024 Dec 16;25(24):13486.
doi: 10.3390/ijms252413486.

Immune Response Elicited by Recombinant Adenovirus-Delivered Glycoprotein B and Nucleocapsid Protein UL18 and UL25 of HSV-1 in Mice

Affiliations

Immune Response Elicited by Recombinant Adenovirus-Delivered Glycoprotein B and Nucleocapsid Protein UL18 and UL25 of HSV-1 in Mice

Haobo Zhang et al. Int J Mol Sci. .

Abstract

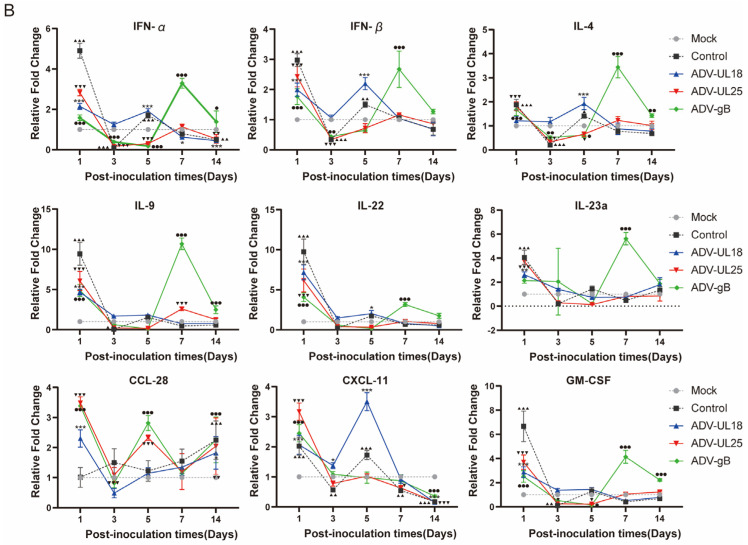
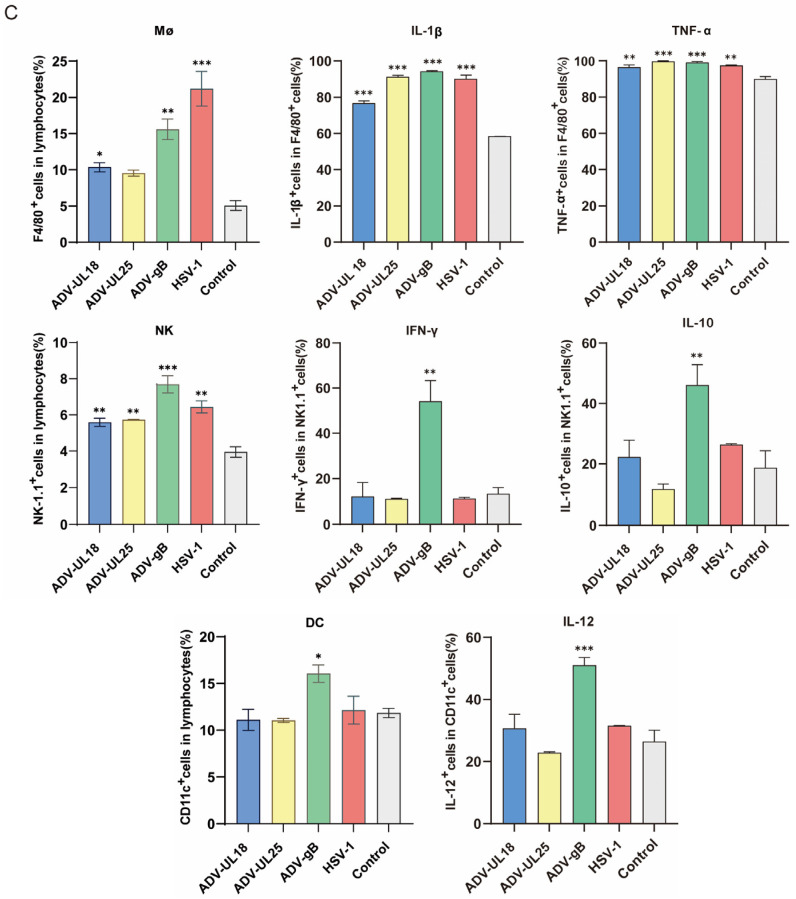
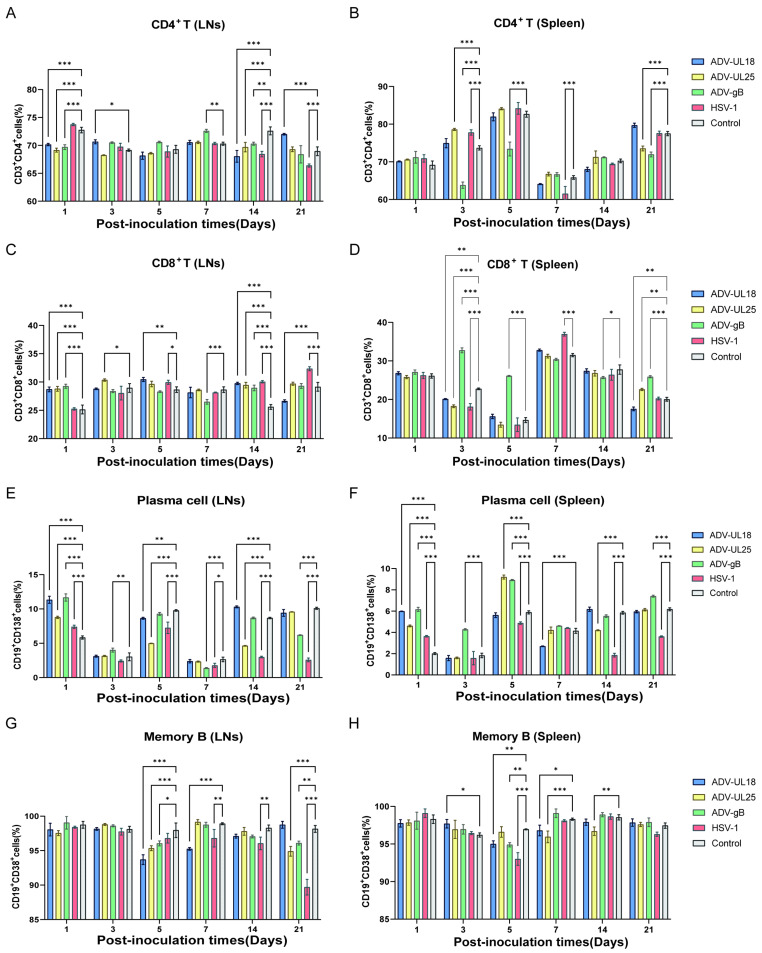
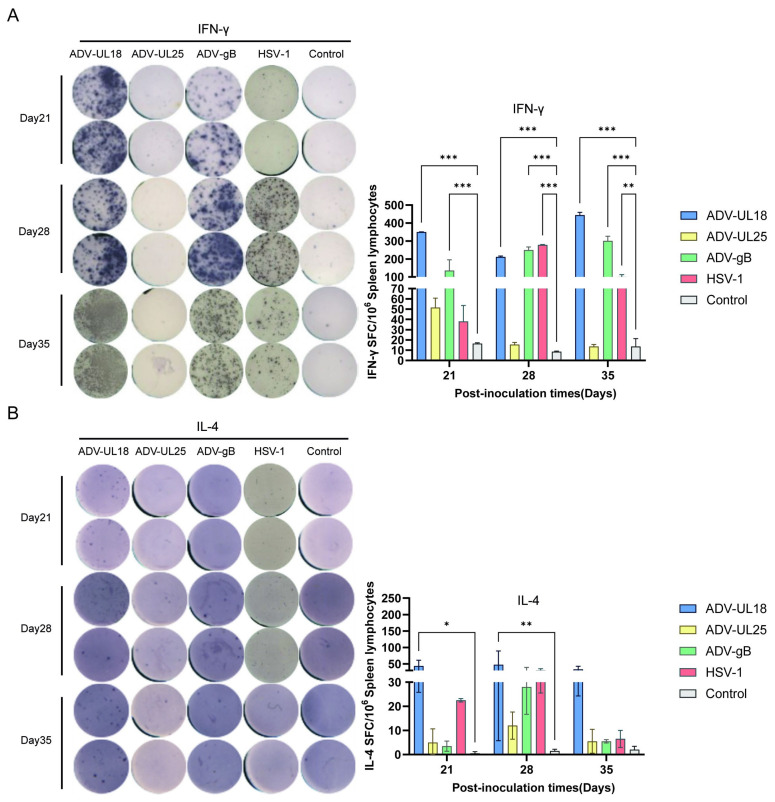
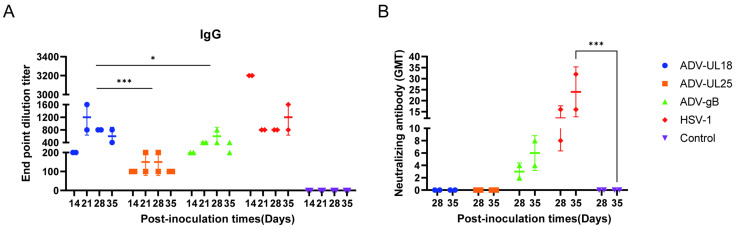
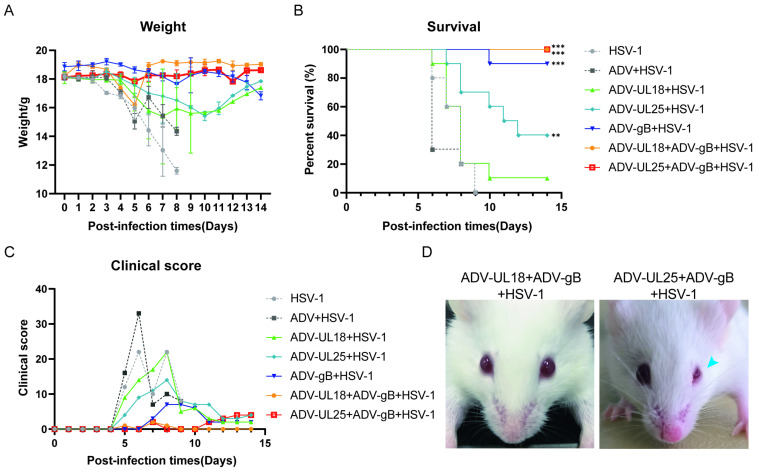
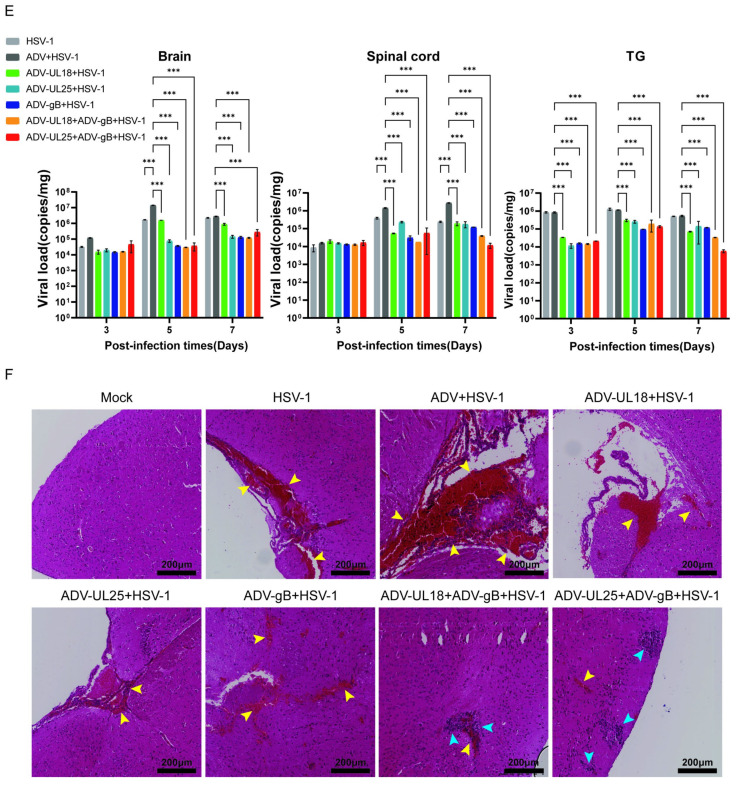
Due to the complex pathogenic and immune escape mechanisms of herpes simplex virus type 1 (HSV-1), especially the failure of induced immune responses to block the initial cell-to-cell transmission of the virus from skin cells to neurons, the body struggles to establish effective prevention and control methods, resulting in the failure of currently developed vaccines. Previous studies have highlighted the crucial roles of surface glycoproteins and nucleocapsid proteins in activating the body's immune defense system against HSV-1 infection. In this study, recombinant adenoviruses were used as vectors to generate adenoviruses carrying the nucleocapsid protein genes UL18 and UL25, as well as the surface glycoprotein gene gB. This approach aimed to mimic the protein expression process that occurs following viral infection of the host and to investigate the immune response characteristics induced by UL18, UL25, and gB proteins. The findings revealed that UL18, UL25, and gB proteins could all trigger the expression of genes associated with innate immune responses; however, the specific genes induced varied in type and level. Furthermore, all three proteins were capable of promoting the proliferation of CD8+ T cells in the lymph nodes. Notably, only UL18 and gB could elicit a Th1 cell immune response. Interestingly, among these proteins, only UL18 could also induce a relatively higher IL-4 level, indicating a Th2 cell immune response. In addition to cellular immunity, all three proteins stimulated the production of specific IgG antibodies. Notably, UL18 induced higher and more sustained levels of specific IgG antibodies in mice. By contrast, only glycoprotein gB induced lower levels of neutralizing antibodies in mice. Moreover, when these mice were challenged with HSV-1, the co-immunization with UL18 and gB provided better protection than gB alone. In conclusion, HSV-1 surface glycoproteins and nucleocapsid proteins exhibit differences in their ability to induce innate and adaptive immunity in the body, suggesting potential avenues for vaccine design by leveraging their complementary advantages.

Keywords: UL18; UL25; glycoprotein B; herpes simplex virus type 1; nucleocapsid protein.


Conflict of interest statement

The authors declare no conflicts of interest.

Figures

Figure 1
Figure 1
The expression of recombinant adenoviruses ADV-UL18, ADV-UL25, and ADV-gB in vitro. (A) Schematic diagram of the construction of recombinant adenoviruses ADV-UL18, ADV-UL25, and ADV-gB. (B) Fluorescence detection of protein expressions. (C) Western blotting to confirm protein expression using anti-EGFP antibody for protein detection. UL18-EGFP is approximately 62 kDa, UL25-EGFP is approximately 90 kDa, gB-EGFP is approximately 126.5 kDa, and EGFP is approximately 26 kDa. “Mock” represents the blank control (untreated 293T cells), while “Control” represents the adenovirus vector-transduced 293T cells. All samples were collected 24 h after transduction.
Figure 2
Figure 2
The expression of recombinant adenoviruses ADV-UL18, ADV-UL25, and ADV-gB in vivo. (A) In vivo imaging detects protein expression in mice. The mice were intranasally inoculated with recombinant adenovirus. Red in the heat map indicates relatively high expression levels, while purple indicates relatively low expression levels. (B) Transcription of UL18, UL25, and UL27 (gB) genes in the lymph nodes of mice inoculated intranasally with recombinant adenovirus. (C) Detection of EGFP protein expression in the lymph nodes by immunofluorescence. (D) Detection of UL18 protein expression in the lymph nodes by immunofluorescence. (E) Detection of UL25 protein expression in the lymph nodes by immunofluorescence. (F) Detection of gB protein expression in the lymph nodes by immunofluorescence. The relative Ct (ΔΔCt) method was used to normalize the relative expression levels of mRNA at each time point in each group to the corresponding mRNA expression level on day 1 in each group. The Scheir–Ray–Hare test was performed. Data are presented as the mean ± SD based on data from three independent experiments. ** p < 0.01, *** p < 0.001.
Figure 3
Figure 3
Innate immune response triggered by UL18, UL25, and gB in mice. (A) Heatmap showing the expression of innate immune factors at different time points after inoculation with recombinant adenovirus. The data for each group were compared with the control group (inoculated with blank adenoviral vector). (B) Expression of nine major factors at different time points after inoculation with recombinant adenovirus. The comparative Ct (ΔΔCt) method was utilized to standardize the relative mRNA expression levels in the experimental group to those of the mock group (the naïve mice group) at each time point. The Scheir–Ray–Hare test was conducted. Data are presented as the mean ± SD based on three independent experiments. ▲, Control vs. Mock. *, ADV-UL18 vs. Mock. ▼, ADV-UL25 vs. Mock. ●, ADV-gB vs. Mock. ▲ p < 0.05, ▲▲ p < 0.01, ▲▲▲ p < 0.001; * p < 0.05, ** p < 0.01, *** p < 0.001; ▼ p < 0.05, ▼▼ p < 0.01, ▼▼▼ p < 0.001; ● p < 0.05, ●● p < 0.01, ●●● p < 0.001. (C) The percentage of innate immune cells among total lymphocytes in the spleen of mice and the factors they secrete on the third day after inoculated with recombinant adenovirus. The data for each group were compared with the control group (inoculated with blank adenoviral vector). * p < 0.05, ** p < 0.01, *** p < 0.001.
Figure 3
Figure 3
Innate immune response triggered by UL18, UL25, and gB in mice. (A) Heatmap showing the expression of innate immune factors at different time points after inoculation with recombinant adenovirus. The data for each group were compared with the control group (inoculated with blank adenoviral vector). (B) Expression of nine major factors at different time points after inoculation with recombinant adenovirus. The comparative Ct (ΔΔCt) method was utilized to standardize the relative mRNA expression levels in the experimental group to those of the mock group (the naïve mice group) at each time point. The Scheir–Ray–Hare test was conducted. Data are presented as the mean ± SD based on three independent experiments. ▲, Control vs. Mock. *, ADV-UL18 vs. Mock. ▼, ADV-UL25 vs. Mock. ●, ADV-gB vs. Mock. ▲ p < 0.05, ▲▲ p < 0.01, ▲▲▲ p < 0.001; * p < 0.05, ** p < 0.01, *** p < 0.001; ▼ p < 0.05, ▼▼ p < 0.01, ▼▼▼ p < 0.001; ● p < 0.05, ●● p < 0.01, ●●● p < 0.001. (C) The percentage of innate immune cells among total lymphocytes in the spleen of mice and the factors they secrete on the third day after inoculated with recombinant adenovirus. The data for each group were compared with the control group (inoculated with blank adenoviral vector). * p < 0.05, ** p < 0.01, *** p < 0.001.
Figure 4
Figure 4
Effects of UL18, UL25, and gB on T- and B-cell subsets in mice. (A) Percentage of CD4+ T cells out of total T cells in the lymph nodes. (B) Percentage of CD4+ T cells out of total T cells in the spleen. (C) Percentage of CD8+ T cells out of total T cells in the lymph nodes. (D) Percentage of CD8+ T cells out of total T cells in the spleen. (E) Percentage of plasma cells out of total B cells in the lymph nodes. (F) Percentage of plasma cells out of total B cells in the spleen. (G) Percentage of memory B cells out of total B cells in the lymph nodes. (H) Percentage of memory B cells out of total B cells in the spleen. The Scheir–Ray–Hare test was conducted. Data are presented as the mean ± SD based on data from two independent experiments. Data at each time point in each group were compared with those of the control group (inoculated with a blank adenovirus vector). * p < 0.05, ** p < 0.01, *** p < 0.001.
Figure 5
Figure 5
Analysis of specific T-cell responses elicited by UL18, UL25, and gB using ELISpot assay. (A) Statistical analysis of spots (left) and numbers (right) in each well on the IFN-γ ELISpot plate. (B) Statistical analysis of spots (left) and numbers (right) in each well on the IL-4 ELISpot plate. Stimulants: UL18 recombinant protein (3 µg/well) in the ADV-UL18 group, UL25 recombinant protein (3 µg/well) in the ADV-UL25 group, gB recombinant protein (3 µg/well) in the ADV-gB group, UL18 + UL25 + gB recombinant proteins (1 µg/well per protein, total 3 µg/well) in the control group and HSV-1 group. The data at each time point in each group were compared with those of the control group (inoculated with a blank adenovirus vector). * p < 0.05, ** p < 0.01, *** p < 0.001.
Figure 6
Figure 6
UL18, UL25, and gB can elicit antibody responses in mice. (A) Specific IgG antibodies were induced by three groups of recombinant adenoviruses. ELISA plate coating: The ADV-UL18 group was coated with UL18 protein, the ADV-UL25 group with UL25 protein, and the ADV-gB group with gB protein, while the control group and HSV-1 group were coated with UL18 + UL25 + gB protein. (B) Neutralizing antibodies against the HSV-1 McKrae strain were induced by three groups of recombinant adenoviruses. The data at each time point in each group were compared with those of the control group (inoculated with a blank adenovirus vector). * p < 0.05, *** p < 0.001.
Figure 7
Figure 7
Protection elicited by UL18, UL25, and gB proteins in mice. (A) Changes in body weight of mice infected with HSV-1 (n = 10/group). (B) Survival rate of mice infected with HSV-1 (n = 10/group). The data of each group were compared with those of the HSV-1 group. ** p < 0.01, *** p < 0.001. (C) Total scores of clinical symptoms of HSV-1 infected mice in each group (0, healthy; 1, inverted hair/back arching; 2, blindness; 3, limb paralysis; 4, death) (n = 10/group). (D) Ocular symptoms of mice in the ADV-UL18 + ADV-gB and ADV-UL25 + ADV-gB groups after HSV-1 infection (blue arrow indicates blindness). (E) Viral load in the brain, spinal cord, and trigeminal ganglia (TG) of infected mice (n = 3/group). Data are presented as the mean ± SD from three independent mice. Data at each time point for each group were compared with those of the control group (ADV + HSV-1). *** p < 0.001. (F) Brain histopathology analysis by H&E staining (n = 3/group) (yellow arrow indicates tissue bleeding; blue arrow indicates inflammatory cell infiltration).
Figure 7
Figure 7
Protection elicited by UL18, UL25, and gB proteins in mice. (A) Changes in body weight of mice infected with HSV-1 (n = 10/group). (B) Survival rate of mice infected with HSV-1 (n = 10/group). The data of each group were compared with those of the HSV-1 group. ** p < 0.01, *** p < 0.001. (C) Total scores of clinical symptoms of HSV-1 infected mice in each group (0, healthy; 1, inverted hair/back arching; 2, blindness; 3, limb paralysis; 4, death) (n = 10/group). (D) Ocular symptoms of mice in the ADV-UL18 + ADV-gB and ADV-UL25 + ADV-gB groups after HSV-1 infection (blue arrow indicates blindness). (E) Viral load in the brain, spinal cord, and trigeminal ganglia (TG) of infected mice (n = 3/group). Data are presented as the mean ± SD from three independent mice. Data at each time point for each group were compared with those of the control group (ADV + HSV-1). *** p < 0.001. (F) Brain histopathology analysis by H&E staining (n = 3/group) (yellow arrow indicates tissue bleeding; blue arrow indicates inflammatory cell infiltration).

Similar articles

References

    1. Zhu S., Viejo-Borbolla A. Pathogenesis and virulence of herpes simplex virus. Virulence. 2021;12:2670–2702. doi: 10.1080/21505594.2021.1982373. - DOI - PMC - PubMed
    1. WHO. [(accessed on 5 April 2023)]. Available online: https://www.who.int/news-room/fact-sheets/detail/herpes-simplex-virus.
    1. Looker K.J., Magaret A.S., May M.T., Turner K.M.E., Vickerman P., Newman L.M., Gottlieb S.L. First estimates of the global and regional incidence of neonatal herpes infection. Lancet Glob. Health. 2017;5:e300–e309. doi: 10.1016/S2214-109X(16)30362-X. - DOI - PMC - PubMed
    1. Connolly S.A., Jardetzky T.S., Longnecker R. The structural basis of herpesvirus entry. Nat. Rev. Microbiol. 2021;19:110–121. doi: 10.1038/s41579-020-00448-w. - DOI - PMC - PubMed
    1. Wilson A.C., Mohr I. A cultured affair: HSV latency and reactivation in neurons. Trends Microbiol. 2012;20:604–611. doi: 10.1016/j.tim.2012.08.005. - DOI - PMC - PubMed

MeSH terms

Substances

LinkOut - more resources