. 2024 Dec 18;25(24):13545.
doi: 10.3390/ijms252413545.

H3K4me3 Genome-Wide Distribution and Transcriptional Regulation of Transposable Elements by RNA Pol2 Deposition

Affiliations

H3K4me3 Genome-Wide Distribution and Transcriptional Regulation of Transposable Elements by RNA Pol2 Deposition

Xiaowei Chen et al. Int J Mol Sci. .

Abstract

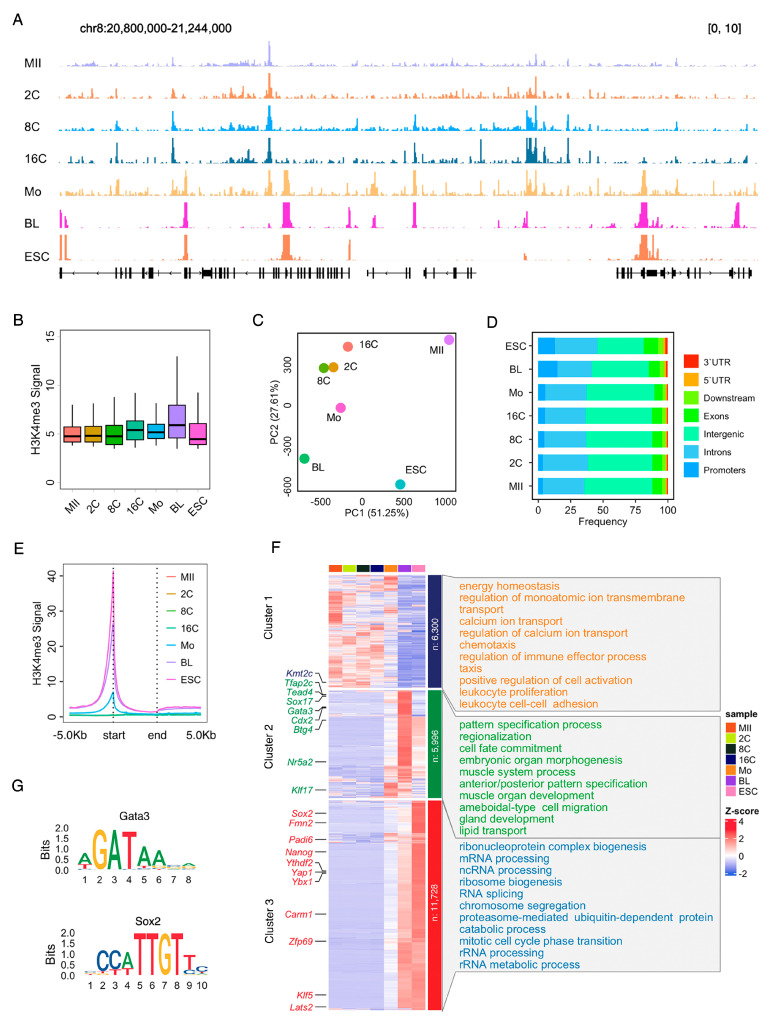
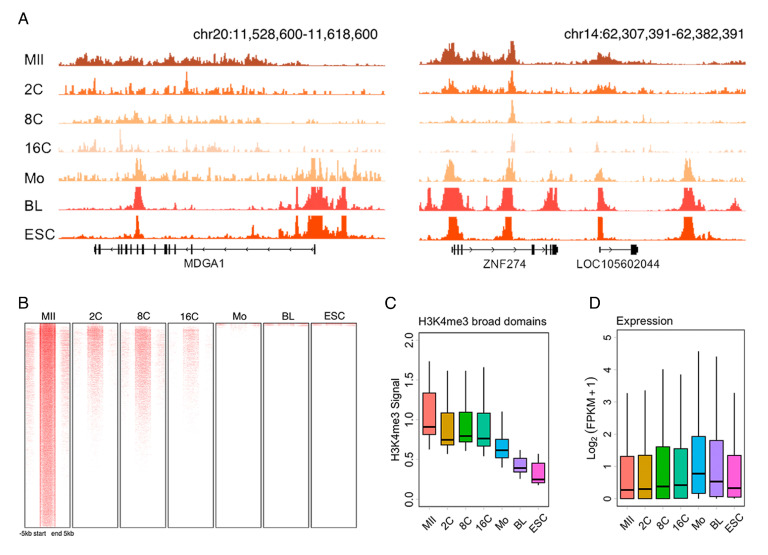
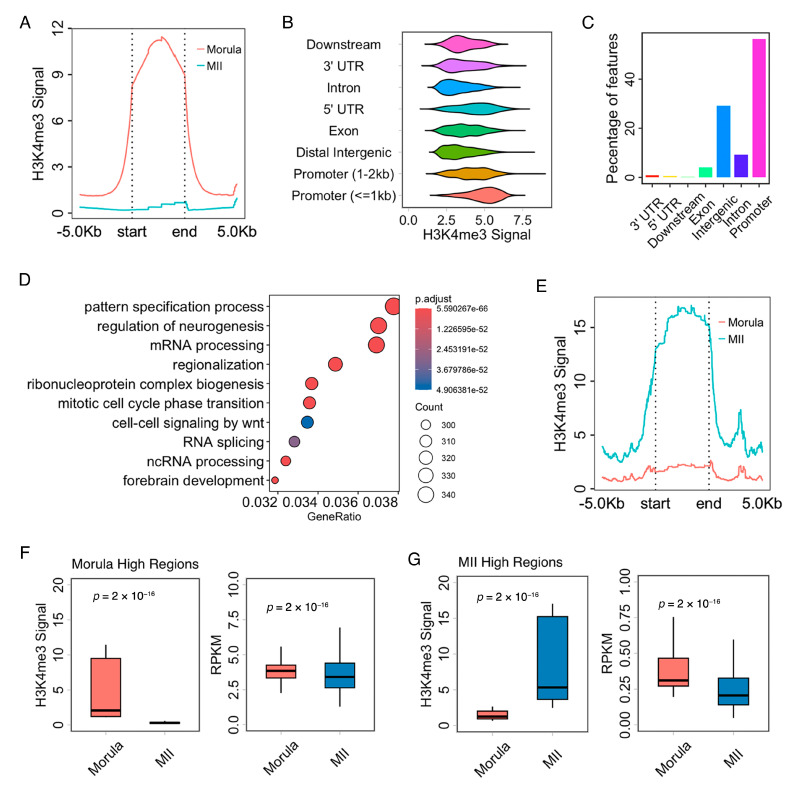
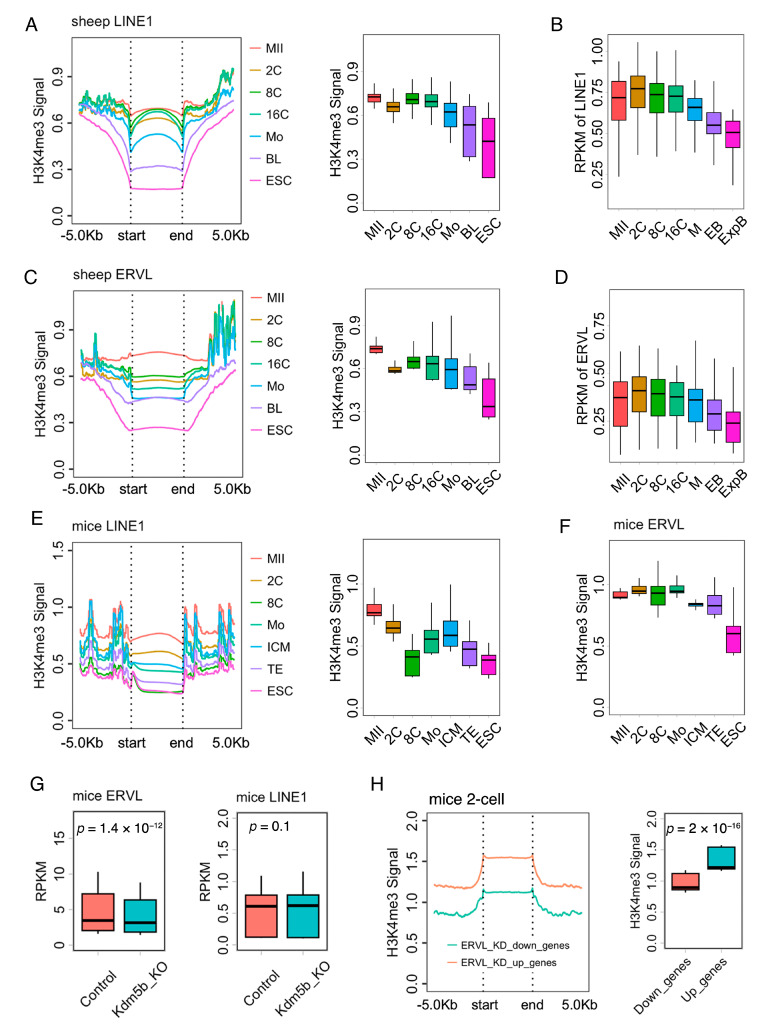
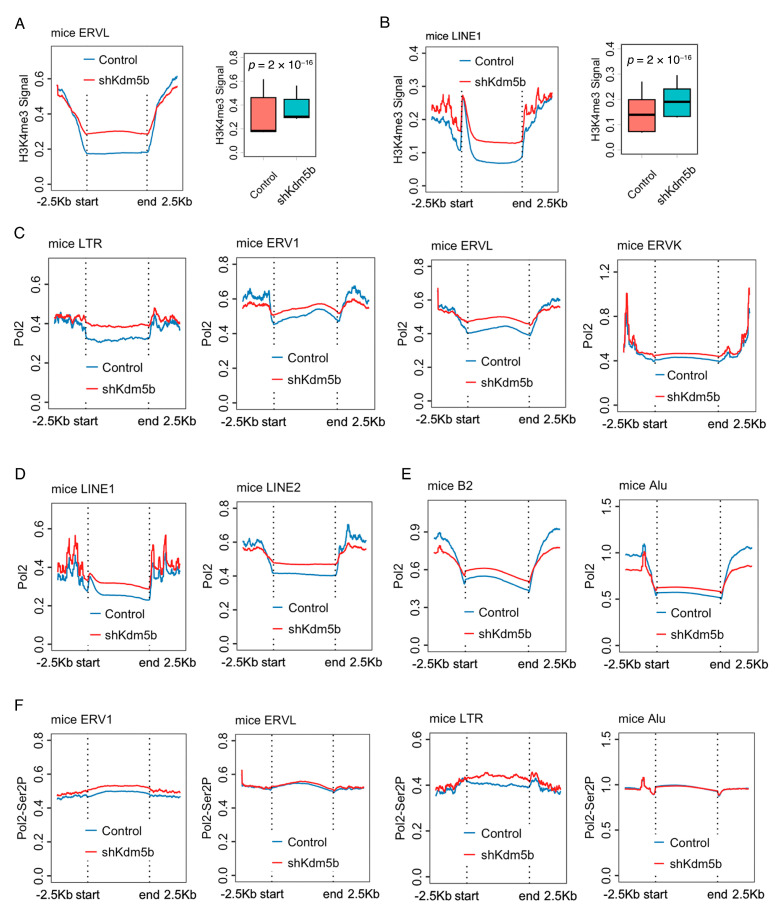
Zygotic genome activation (ZGA) is critical for early embryo development and is meticulously regulated by epigenetic modifications. H3K4me3 is a transcription-permissive histone mark preferentially found at promoters, but its distribution across genome features remains incompletely understood. In this study, we investigated the genome-wide enrichment of H3K4me3 during early embryo development and embryonic stem cells (ESCs) in both sheep and mice. We discovered that broad H3K4me3 domains were present in MII stage oocytes and were progressively diminished, while promoter H3K4me3 enrichment was increased and correlated with gene upregulation during ZGA in sheep. Additionally, we reported the dynamic distribution of H3K4me3 at the transposable elements (TEs) during early embryo development in both sheep and mice. Specifically, the H3K4me3 distribution of LINE1 and ERVL, two subsets of TEs, was associated with their expression during early embryo development in sheep. Furthermore, H3K4me3 enrichment in TEs was greatly increased during ZGA following Kdm5b knockdown, and the distribution of RNA polymerase II (Pol2) in TEs was also markedly increased in Kdm5b knockout ESCs in mice. These findings suggest that H3K4me3 plays important roles in regulating TE expression through interaction with RNA Pol2, providing valuable insights into the regulation of ZGA initiation and cell fate determination by H3K4me3.

Keywords: H3K4me3; RNA Pol2; embryonic stem cells; transposable elements; zygotic genome activation.


Conflict of interest statement

The authors declare no conflicts of interest.

Figures

Figure 1
Figure 1
Genome-wide profiling of H3K4me3 during sheep early embryo development. (A) Snapshot of H3K4me3 distribution in chromosome 8 in the oocyte, 2-, 8-, and 16-cell stage embryos, morula embryos, blastocyst embryos, and ESCs in sheep. (B) Boxplot of H3K4me3 signals in sheep early embryos. (C) PCA plot showed that H3K4me3 enriched regions of 2-, 4-, 8-, and 16-cell stage embryos, MII stage oocytes, morula, blastocyst, and ESCs were clearly separated from each other. (D) Frequency of H3K4me3 enrichment of the early embryo in the genome features. (E) Metaplot of H3K4me3 in transcription start site (start) and transcription end sites (end) in the oocyte, 2-, 8-, and 16-cell stage embryos, morula embryos, blastocyst embryos, and ESCs in sheep. (F) Heatmap and Gene Ontology analysis of the promoter H3K4me3 in the oocyte, 2-, 8-, and 16-cell stage embryos, morula embryos, blastocyst embryos, and ESCs in sheep. (G) Motif analysis revealed H3K4me3 enrichment in Gata3 in blastocyst and Sox2 in ESC. MII, MII stage oocytes; 2C/8C/16C, 2-, 8-, and 16-cell stage embryos; Mo, morula embryos; BL, blastocyst embryos; ESC, embryonic stem cell.
Figure 2
Figure 2
Removal of H3K4me3 broad domains during early embryo development. (A) Snapshot revealing that H3K4me3 broad domains occurred in sheep MII stage oocytes and were shifted to sharp peaks after fertilization. (B,C) Heatmaps and boxplot showing removal of H3K4me3 broad domains during early embryo development. (D) The distribution of H3K4me3 broad domain-deposited genes during early embryo development in sheep.
Figure 3
Figure 3
Increased H3K4me3 distribution correlates with gene upregulation during ZGA (A) Identification of morula-higher H3K4me3 peaks by comparing the distribution of H3K4me3 in the MII stage oocytes and the morula embryos. (B) Morula-specific H3K4me3 signal in various genome features. (C) Frequency of morula-higher H3K4me3 regions in the genome features. (D) Gene Ontology analysis of morula-higher H3K4me3 peaks. (E) Identification of oocyte-higher H3K4me3 peaks by comparing the distribution of H3K4me3 in the MII stage oocytes and the morula embryos. (F) Boxplot of H3K4me3 signal in morula-higher peaks and gene expression of morula-higher peak-deposited genes in the MII stage oocytes and the morula embryos. (G) Boxplot of H3K4me3 signal in oocyte-higher peaks and gene expression of morula-higher peak-deposited genes in the MII stage oocytes and the morula embryos.
Figure 4
Figure 4
Dynamic H3K4me3 changes at TEs during early embryo development. (A) Metaplot and boxplot of H3K4me3 in LINE1 in oocyte, 2-, 8-, and 16-cell stage embryos, morula embryos, blastocyst embryos, and ESCs in sheep. (B) Expression of LINE1 during early embryo development in sheep. (C) Metaplot and boxplot of H3K4me3 in ERVL in oocytes, 2-, 8-, and 16-cell stage embryos, morula embryos, blastocyst embryos, and ESCs in sheep. (D) Expression of ERVL during early embryo development in sheep. (E) Metaplot and boxplot of H3K4me3 in LINE1 in oocytes, 2-, and 8-cell stage embryos, morula embryos, ICM. TE, and ESCs in mice. (F) Metaplot and boxplot of H3K4me3 in ERVL in oocytes, 2-, and 8-cell stage embryos, morula embryos, ICM, TE, and ESCs in mice. (G) Expression of LINE1 and ERVL in the control and the Kdm5b knockdown embryos at the 2-cell stage. (H) Metaplot and boxplot of H3K4me3 in upregulation and/or downregulation genes after ERVL was knocked down in mouse 2-cell stage embryos. MII, MII stage oocytes; 2C/8C/16C, 2-, 8-, and 16-cell stage embryos; Mo, morula embryos; BL, blastocyst embryos; ICM, inner cell mass; TE, trophectoderm; ESC, embryonic stem cell. RPKM, Reads Per Kilobase per Million mapped reads.
Figure 5
Figure 5
Increment RNA Pol2 distribution in TEs in Kdm5b knockout ESCs. (A,B) Metaplot and boxplot of H3K4me3 in LINE1 and/or ERVL in Kdm5b knockdown ESCs. (C) Metaplot and boxplot of RNA Pol2 in LTR, ERV1, ERVL, and ERVK in Kdm5b knockdown ESCs. (D) Metaplot and boxplot of RNA Pol2 in LINE1 and LINE2 in Kdm5b knockdown ESCs. (E) Metaplot and boxplot of RNA Pol2 in SINE B2 and Alu in Kdm5b knockdown ESCs. (F) Metaplot and boxplot of RNA Pol2 Ser2P in ERV1, ERVL, LTR, and Alu in Kdm5b knockdown ESCs.

Similar articles

Cited by

References

    1. Kobayashi W., Tachibana K. Awakening of the zygotic genome by pioneer transcription factors. Curr. Opin. Struct. Biol. 2021;71:94–100. doi: 10.1016/j.sbi.2021.05.013. - DOI - PubMed
    1. Sotomayor-Lugo F., Iglesias-Barrameda N., Castillo-Aleman Y.M., Casado-Hernandez I., Villegas-Valverde C.A., Bencomo-Hernandez A.A., Ventura-Carmenate Y., Rivero-Jimenez R.A. The Dynamics of Histone Modifications during Mammalian Zygotic Genome Activation. Int. J. Mol. Sci. 2024;25:1459. doi: 10.3390/ijms25031459. - DOI - PMC - PubMed
    1. Zhou C.Y., Heald R. Principles of genome activation in the early embryo. Curr. Opin. Genet. Dev. 2023;81:102062. doi: 10.1016/j.gde.2023.102062. - DOI - PMC - PubMed
    1. Liu C., Ma Y., Shang Y., Huo R., Li W. Post-translational regulation of the maternal-to-zygotic transition. Cell. Mol. Life Sci. CMLS. 2018;75:1707–1722. doi: 10.1007/s00018-018-2750-y. - DOI - PMC - PubMed
    1. Schulz K.N., Harrison M.M. Mechanisms regulating zygotic genome activation. Nat. Rev. Genet. 2019;20:221–234. doi: 10.1038/s41576-018-0087-x. - DOI - PMC - PubMed

MeSH terms

LinkOut - more resources