. 2024 Dec 18;25(24):13548.
doi: 10.3390/ijms252413548.

Nanosilver-Biopolymer-Silica Composites: Preparation, and Structural and Adsorption Analysis with Evaluation of Antimicrobial Properties

Affiliations

Nanosilver-Biopolymer-Silica Composites: Preparation, and Structural and Adsorption Analysis with Evaluation of Antimicrobial Properties

Magdalena Blachnio et al. Int J Mol Sci. .

Abstract

In this article, we report on the research on the synthesis of composites based on a porous, highly ordered silica material modified by a metallic nanophase and chitosan biofilm. Due to the ordered pore system of the SBA-15 silica, this material proved to be a good carrier for both the biologically active nanophase (highly dispersed silver nanoparticles, AgNPs) and the adsorption active phase (chitosan). The antimicrobial susceptibility was determined against Gram-positive Staphylococcus aureus ATCC 25923, Gram-negative bacterial strains (Escherichia coli ATCC 25922, Klebsiella pneumoniae ATCC 700603, and Pseudomonas aeruginosa ATCC 27853), and yeast Candida albicans ATCC 90028. The zones of microbial growth inhibition correlated with the content of silver nanoparticles deposited in the composites and were the largest for C. albicans (14-21 mm) and S. aureus (12-17 mm). The suitability of the composites for the purification of water and wastewater from anionic pollutants was evaluated based on kinetic and equilibrium adsorption studies for the dye Acid Red 88. The composite with the highest amount of the chitosan component showed the greatest adsorption capacity (am) of 0.57 mmol/g and the most effective kinetics with a rate constant (log k) and half-time (t0.5) of -0.21 and 1.62 min, respectively. Due to their great practical importance, AgNP-chitosan-silica composites can aspire to be classified as functional materials combining the environmental problem with microbiological activity.

Keywords: adsorption equilibrium; adsorption kinetics; biopolymer; chitosan; dye adsorption; nanosilver–chitosan–silica composite; silica.


Conflict of interest statement

The authors declare no conflicts of interest.

Figures

Figure 1
Figure 1
Schematic representation of the action of silver nanoparticles on bacterial cells using the example of the E. coli bacteria model.
Figure 2
Figure 2
The process of silver ion reduction controlled by UV–Vis technique: (A) changes in the concentration of silver nanoparticles in the process of reduction of diamminesilver(I) ions; and (B) UV–Vis spectra of silver nanoparticle solutions recorded after specific time intervals from the establishment of equilibrium. Each spectrum in Figure 2B was recorded in the wavelength range of 300 to 900 nm.
Figure 3
Figure 3
UV–Vis spectra for pure SBA-15 and composites with different contents of silver nanoparticles.
Figure 4
Figure 4
(A) Nitrogen adsorption–desorption isotherms at 77 K for the analyzed samples, (B) porosity distributions calculated with the BJH theory from the adsorption, and (C) desorption branches of the isotherms as a function of pore size (in a differential form dV/dD, where V and D are pore volume and diameter, respectively).
Figure 4
Figure 4
(A) Nitrogen adsorption–desorption isotherms at 77 K for the analyzed samples, (B) porosity distributions calculated with the BJH theory from the adsorption, and (C) desorption branches of the isotherms as a function of pore size (in a differential form dV/dD, where V and D are pore volume and diameter, respectively).
Figure 5
Figure 5
Dependences of surface charge density of the composites AgChS1–AgChS3 on solution pH.
Figure 6
Figure 6
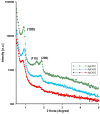
The powder XRD patterns in the range of small diffraction angles for AgChS1–AgChS3 samples.
Figure 7
Figure 7
XRD images of the biopolymer–nanosilver composites AgChS1–AgChS3 and experimental comparison curves of chitosan and silica components.
Figure 8
Figure 8
Parameterization of the first XRD Ag(111) signal of the tested materials AgChS1 (A), AgChS2 (B), and AgChS3 (C). Inset tables show calculations of the crystallite size relative to the plane perpendicular to the (111), (200), (220), and (311) directions together with the average silver crystallite size D (nm).
Figure 8
Figure 8
Parameterization of the first XRD Ag(111) signal of the tested materials AgChS1 (A), AgChS2 (B), and AgChS3 (C). Inset tables show calculations of the crystallite size relative to the plane perpendicular to the (111), (200), (220), and (311) directions together with the average silver crystallite size D (nm).
Figure 9
Figure 9
Transmission electron micrographs (TEMs) for the AgNP–chitosan–silica composites AgChS1 (A,B), AgChS2 (C,D), and AgChS3 (E,F).
Figure 10
Figure 10
Microbial growth inhibition of: S. aureus ATCC 25923, E. coli ATCC 25922, K. pneumoniae ATCC 700603, P. aeruginosa ATCC 27853, and C. albicans ATCC 90028 by tested materials: AgChS1–AgChS3, ChSBA, AgNPs, ampicillin (AMP), and amphotericin B (AMPH).
Figure 11
Figure 11
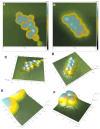
AFM images of Gram-positive Staphylococcus aureus untreated (control sample (A,C,E,G) and Staphylococcus aureus exposed to AgNP–chitosan–silica composite (AgChS3 (B,D,F,H)) (A,B) topography as 2D view and 3D image of the upper surface of bacterial strains (C,D), enlargement of the bacterial envelope area of the control bacteria (E) and the bacteria exposed to the composite material (F), and surface topography of bacteria before (G) and after contact with the material (H).
Figure 11
Figure 11
AFM images of Gram-positive Staphylococcus aureus untreated (control sample (A,C,E,G) and Staphylococcus aureus exposed to AgNP–chitosan–silica composite (AgChS3 (B,D,F,H)) (A,B) topography as 2D view and 3D image of the upper surface of bacterial strains (C,D), enlargement of the bacterial envelope area of the control bacteria (E) and the bacteria exposed to the composite material (F), and surface topography of bacteria before (G) and after contact with the material (H).
Figure 12
Figure 12
AFM images of Gram-negative Escherichia coli untreated (control sample (A,C,E,G) and bacteria exposed to AgChS3 (B,D,F,H)) (A,B) topography as 2D view and 3D image of the upper surface of bacterial strains (C,D), enlargement of the bacterial envelope area of the control bacteria (E) and the bacteria exposed to the composite material (F), and surface topography of bacteria before (G) and after contact with the composite material (H).
Figure 12
Figure 12
AFM images of Gram-negative Escherichia coli untreated (control sample (A,C,E,G) and bacteria exposed to AgChS3 (B,D,F,H)) (A,B) topography as 2D view and 3D image of the upper surface of bacterial strains (C,D), enlargement of the bacterial envelope area of the control bacteria (E) and the bacteria exposed to the composite material (F), and surface topography of bacteria before (G) and after contact with the composite material (H).
Figure 13
Figure 13
(A) Adsorption isotherms of Acid Red 88 on the AgNP–chitosan–silica composites and on the composite ChSBA (as a control material, inset) as a dependence of adsorbed dye amount on equilibrium concentration ceq. (B) Dependence of adsorption capacity am on the nitrogen content in the composites.
Figure 14
Figure 14
Comparison of Acid Red 88 adsorption kinetics on the AgNP–chitosan–silica composites at coordinates: relative concentration~time (A,C); relative concentration~square root of time (B,D). The lines correspond to the fitted m-exponential equation (A,B) and the fractal-like SOE equation (C,D).
Figure 15
Figure 15
Dependence of standard deviations of relative concentration SD(c)/c0 on the number of exponential terms in the multi-exponential equation (A); the relationship between adsorption kinetics at fixed values of the process progress and N content in the composites (B); and distribution of half-time t0.5i (C) and rate coefficient ki (D) for dye adsorption on the composites.
Figure 16
Figure 16
Scheme of the synthesis of stabilized silver nanoparticles solution.

Similar articles

References

    1. Turos E., Shim J.-Y., Wang Y., Greenhalgh K., Reddy G.S.K., Dickey S., Lim D.V. Antibiotic-conjugated polyacrylate nanoparticles: New opportunities for development of anti-MRSA agents. Bioorg. Med. Chem. Lett. 2007;17:53–56. doi: 10.1016/j.bmcl.2006.09.098. - DOI - PMC - PubMed
    1. Allahverdiyev A.M., Kon K.V., Abamor E.S., Bagirova M., Rafailovich M. Coping with antibiotic resistance: Combining nanoparticles with antibiotics and other antimicrobial agents. Expert Rev. Anti-Infect. Ther. 2011;9:1035–1052. doi: 10.1586/eri.11.121. - DOI - PubMed
    1. Sherafati Chaleshtori A., Marzhoseyni Z., Saeedi N., Azar Bahadori R., Mollazadeh S., Pourghadamyari H., Sajadimoghadam E., Abbaszadeh-Goudarzi K., Moradi Hasan-Abad A., Sharafati Chaleshtori R. Gelatin-based nanoparticles and antibiotics: A new therapeutic approach for osteomyelitis? Front. Mol. Biosci. 2024;11:1412325. doi: 10.3389/fmolb.2024.1412325. - DOI - PMC - PubMed
    1. Karachkovska A.D., Syrvatka V.J., Gromyko O.M., Fedorenko V.O. Nanoengineering: Fabrication, Properties, Optics, Thin Films, and Devices XVII. Volume 1146721 SPIE; Bellingham, WA, USA: 2020. Synthesis of antibiotic-silver nanoparticles complexes, their properties, and application for investigation of antibiotic-resistance mechanisms.
    1. Khurana C., Sharma P., Pandey O.P., Chudasama B. Synergistic Effect of Metal Nanoparticles on the Antimicrobial Activities of Antibiotics against Biorecycling Microbes. J. Mater. Sci. Technol. 2016;32:524–532. doi: 10.1016/j.jmst.2016.02.004. - DOI

MeSH terms

LinkOut - more resources