. 2024 Dec 18;25(24):13559.
doi: 10.3390/ijms252413559.

Integrated Transcriptomic, Proteomic, and Metabolomic Analyses Revealed Molecular Mechanism for Salt Resistance in Soybean (Glycine max L.) Seedlings

Affiliations

Integrated Transcriptomic, Proteomic, and Metabolomic Analyses Revealed Molecular Mechanism for Salt Resistance in Soybean (Glycine max L.) Seedlings

Siqi Fu et al. Int J Mol Sci. .

Abstract

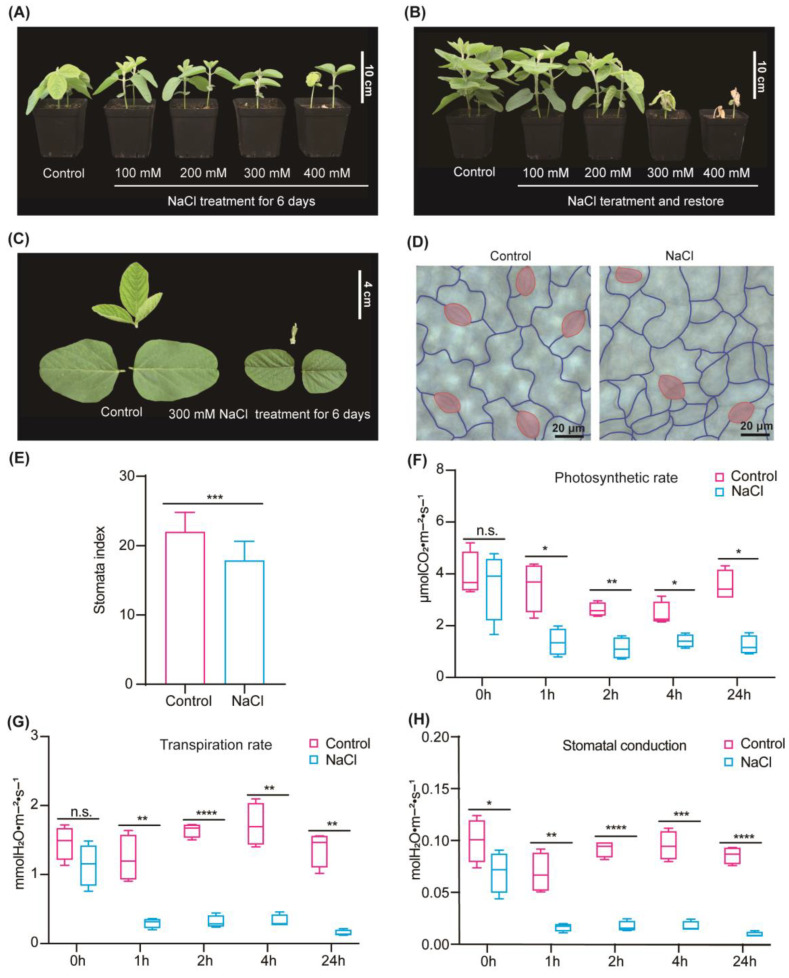
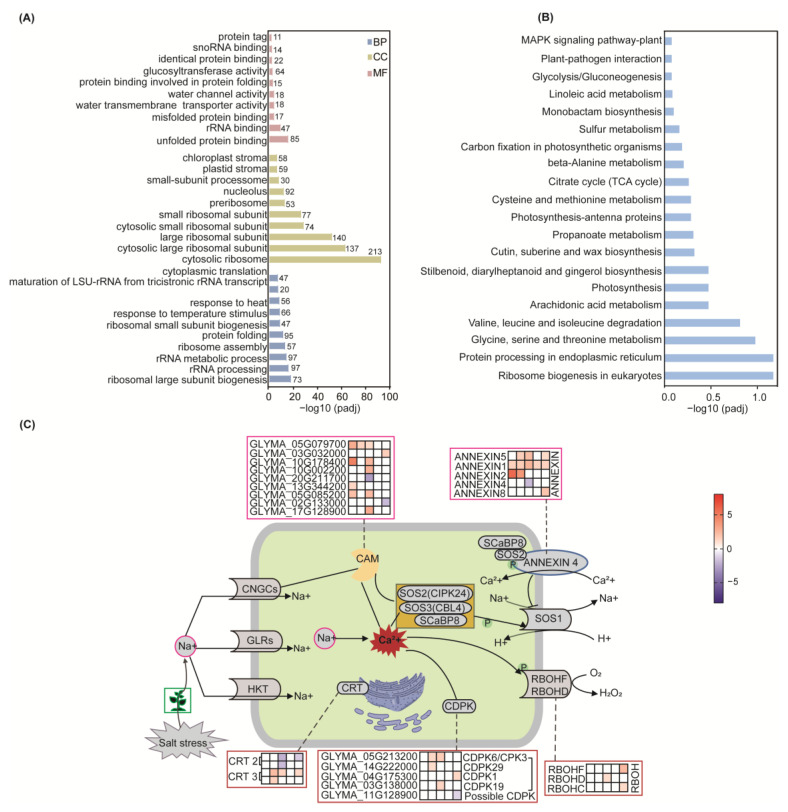
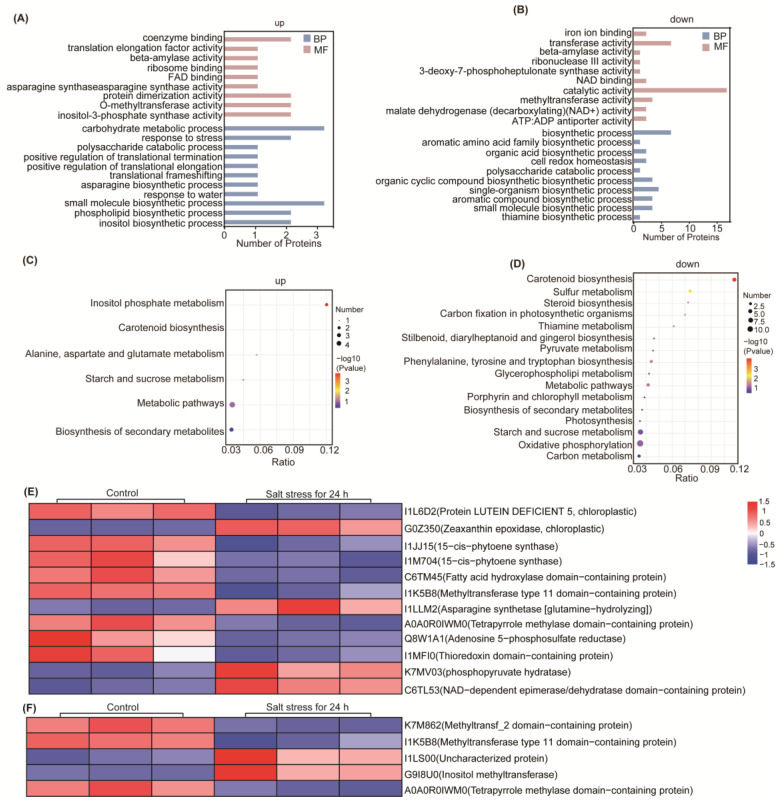
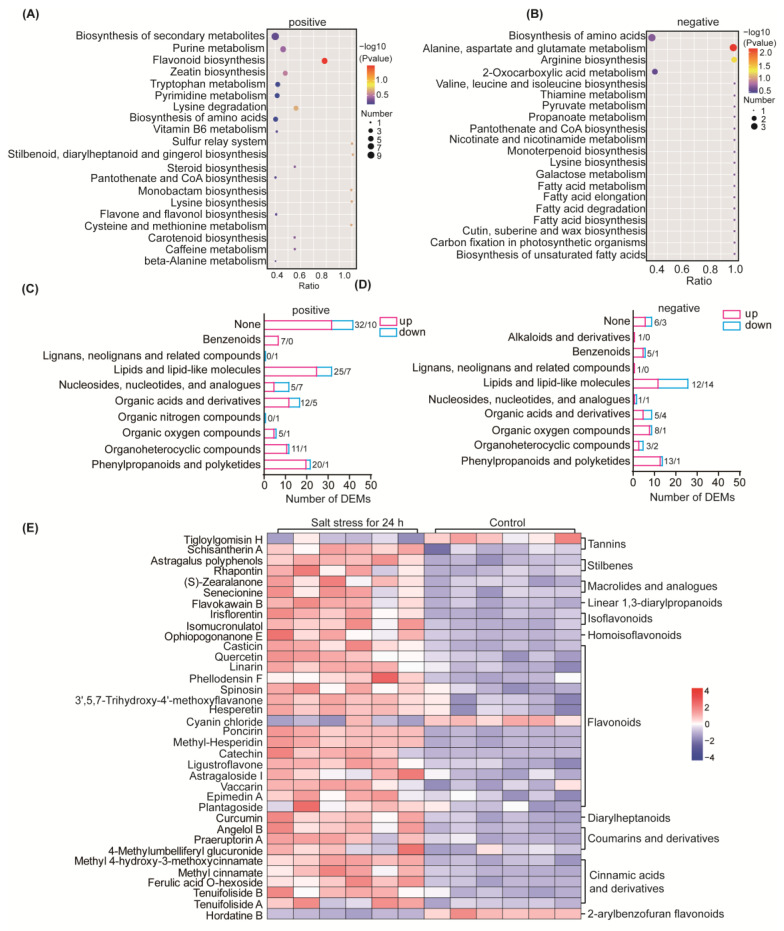
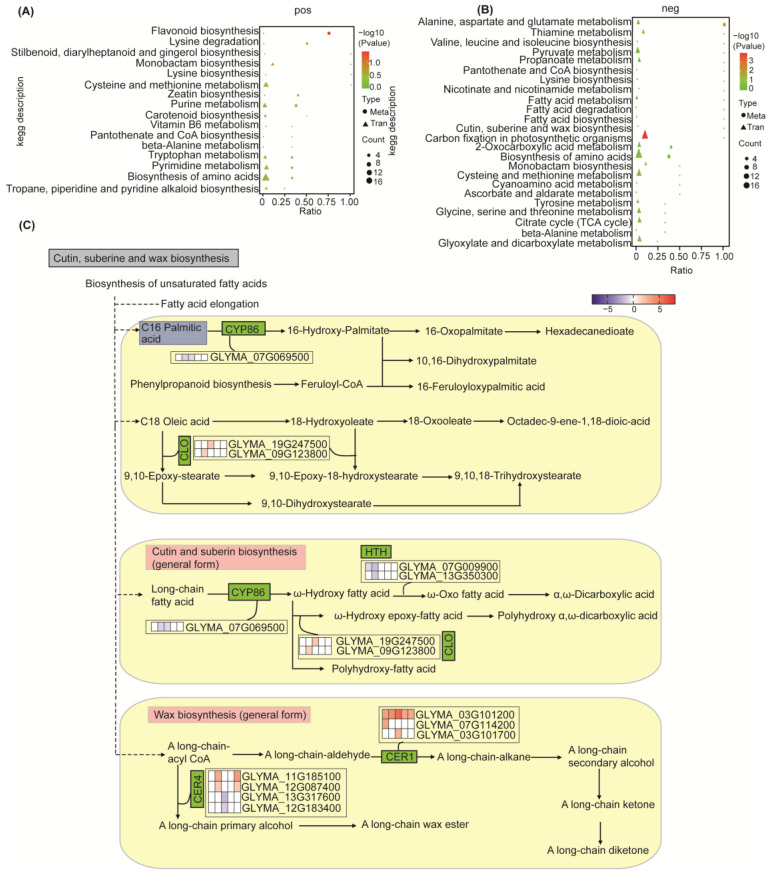
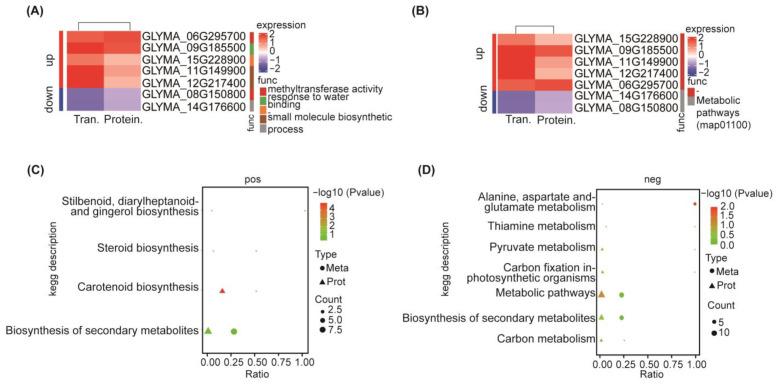
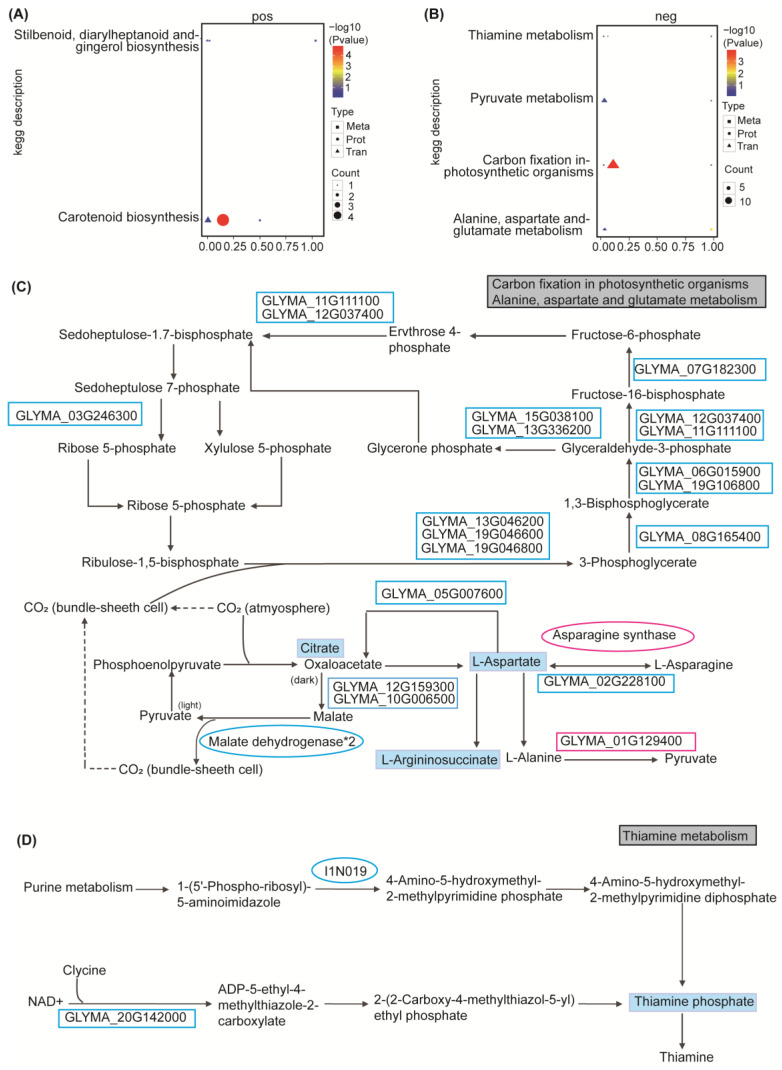
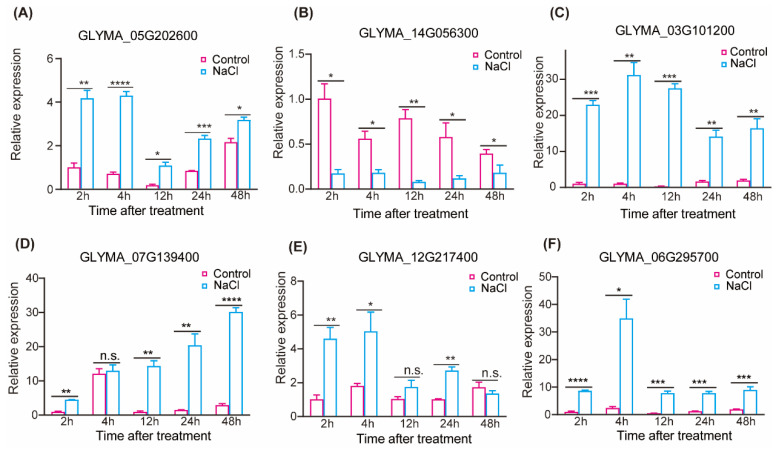
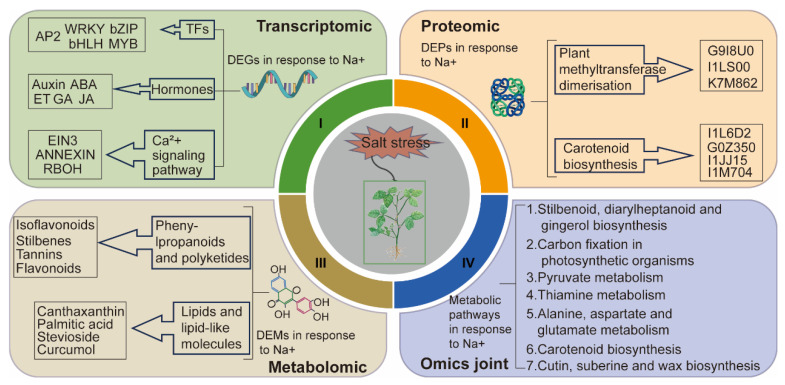
Salt stress poses a significant challenge to plant growth and restricts agricultural development. To delve into the intricate mechanisms involved in soybean's response to salt stress and find targets to improve the salt resistance of soybean, this study integrated transcriptomic, proteomic, and metabolomic analyses to explore the regulatory networks involved in soybean salt tolerance. Transcriptomic analysis revealed significant changes in transcription factors, hormone-related groups, and calcium ion signaling. Notably, the biosynthetic pathways of cutin, suberine, and wax biosynthesis play an important role in this process. Proteomic results indicated salt-induced DNA methylation and the enrichment of phosphopyruvate hydrase post-salt stress, as well as its interaction with enzymes from various metabolic pathways. Metabolomic data unveiled the synthesis of various metabolites, including lipids and flavonoids, in soybean following salt stress. Furthermore, the integrated multiomics results highlighted the activation of multiple metabolic pathways in soybean in response to salt stress, with six pathways standing out prominently: stilbenoid, diarylheptanoid, and gingerol biosynthesis; carotenoid biosynthesis; carbon fixation in photosynthetic organisms; alanine, aspartate, and glutamate metabolism; thiamine metabolism; and pyruvate metabolism. These findings not only offer valuable insights into leveraging multiomics profiling techniques for uncovering salt tolerance mechanisms but also identify candidate genes for soybean improvement.

Keywords: DNA methylation; RNA-seq; abiotic stress; cuticle biosynthesis; multiomics.


Conflict of interest statement

The authors declare that they have no known competing financial interests or personal relationships that could have appeared to influence the work reported in this paper.

Figures

Figure 1
Figure 1
Phenotype and physiological response of soybean seedlings under salt stress. (A) Phenotype of soybean seedlings treated with different concentrations of NaCl for 6 days. (B) Soybean seedlings were treated with different concentrations of NaCl for 11 days and then recovered their phenotype for 6 days. (C) Phenotype of soybean seedlings treated with 300 mM NaCl for 6 days. (D) Stomatal phenotype of soybean seedlings treated with 300 mM NaCl for 6 days. Stomata are shown in red, and the pavement cells are outlined in blue. (E) Stomata index of soybean seedlings treated with 300 mM NaCl for 6 days, t test, n.s.: p > 0.05; *: p ≤ 0.05; **: p ≤ 0.01; ***: p ≤ 0.005; ****: p ≤ 0.001. Each bar represents the means ± SD, n = 15. (FH) Photosynthetic rate (F), Transpiration rate (G), Stomatal conductance (H), t test, n.s.: p > 0.05; *: p ≤ 0.05; **: p ≤ 0.01; ***: p ≤ 0.005; ****: p ≤ 0.001. Each bar represents means ± SD, n = 4.
Figure 2
Figure 2
A total of 300 mM NaCl induces functional enrichment and validation of the transcriptome. (A) GO functional enrichment of DEGs after salt stress. In the figure, the ordinate is GO Term, the abscissa is the significance level of GO Term enrichment, which is represented by − log10 (padj), and different colors represent different functional classifications (BP, MF, CC). (B) KEGG pathway enrichment of DEGs after salt stress. The ordinate is the KEGG pathway, and the abscissa is the significance level of pathway enrichment. (C) Links and changes between calcium ion signal-transduction pathways and plant hormones and transcription factors after salt stress. Ca2+ signaling plays a crucial role in various aspects of plant salt stress response. Salt-sensitive receptors include SOS1 (salt overly sensitive), Na+/H+ antiporters, histidine kinases, AHK1/ATHK1 (Arabidopsis Histidine Kinase), and NSCC (nonselective cation channels). Arabidopsis NSCCs are mainly divided into two categories: cyclic nucleotide-gated channels (CNGCs) and glutamate activation channels (GLRs). Salt-induced Ca2+ signaling activates the SOS pathway and enhances plant salt tolerance, and SOS3/SCaBP8, the main part of the pathway, is the calcium ion-binding protein of EF-hand, which decodes and transmits calcium signaling. Upon receiving the signal, SOS3/sCaBP8 interacts with the terminal regulatory domain of the SOS2 protein, thereby activating SOS2 to form the SOS3/sCaBP8-SOS2 complex. The complex then triggers the activation of the Na+/H+ anti-transporter SOS1 on the plasma membrane, facilitating Na+ efflux through phosphorylation modification. Furthermore, the SOS2-phosphorylated SCaBP8 formation complex interacts with the Ca2+-dependent membrane-bound protein Annexin4 to regulate Ca2+ signaling under salt stress with the SCaBP8-AtANN4-SOS2 complex and improve the Na+/H+ transport activity of the plasma membrane. Moreover, CDPKs play a role in multiple plant signaling pathways downstream of elevated Ca2+ concentrations, thereby regulating various physiological responses. Calreticulin (CRT) is a calcium-binding protein of the endoplasmic reticulum (ER) that has a variety of functions in addition to its role as a chaperone. Plant CRT has antioxidant effect in transgenic plants, which alleviates the oxidative stress of plants and improves the stress resistance of plants. In plants, “respiratory burst oxidase homologous” (RBOH) proteins localize to the plasma membrane and have been reported to regulate various biological processes, including pathogen responses and abiotic stress tolerance, through the ability of ROS to regulate production as a second messenger. Under salt stress, Ca2+ in the cytoplasm transiently activates CAM protein, which opens the signaling network through the calcineurin pathway, thereby attenuating salt-induced damage caused by high Na+ levels. Gradient colors indicate log2-fold changes (FC) in gene expression in leaves at different time points (2, 4, 12, 24, and 48 h) compared to controls (0 h).
Figure 3
Figure 3
300 mM NaCl induces functional enrichment and validation of the Proteomics. (A,B) GO functional enrichment of upregulated and downregulated DEPs. In the figure, the ordinate is GO Term, the abscissa is the significance level of GO Term enrichment, which is represented by −log10 (padj), and different colors represent different functional classifications (BP, MF, CC). (C,D) KEGG metabolic pathway enrichment of upregulated and downregulated DEPs. The horizontal coordinate in the graph is x/y (number of differential proteins in the corresponding metabolic pathway/number of total proteins identified in the pathway), and the larger the value, the higher the enrichment of differential proteins in the pathway. The color of the dots represents the p-value of the hypergeometric test, with smaller values indicating greater reliability and statistical significance of the test. The size of the dots represents the number of differential proteins/metabolites in the corresponding pathway, and the larger the value, the more differential proteins there are in the pathway. (E,F) Changes in methyltransferases after 24 h of salt stress (E). Changes in protein-protein interactions important node proteins after 24 h of salt stress (F). The clustering level of the proteins is shown with the samples grouped vertically, and the colors indicate the normalized converted values of the relative quantification values of the differential metabolites.
Figure 4
Figure 4
Metabolomic changes in soybean seedlings under salt stress. (A,B) KEGG metabolic pathway enrichment of positive-ion DEMs and negative-ion DEMs. Same as Figure 3C,D. (C) Classification of positive DEMs. (D) Classification of negative DEMs. (E) Accumulation of Phenylpropanoids and polyketides after 24 h of salt stress. Clustering of metabolites is shown horizontally, samples are grouped vertically, and colors indicate values after normalization transformation of relative quantitative values of differential metabolites.
Figure 5
Figure 5
Integrated analysis of differentially expressed genes and metabolites in soybean under salt stress. (A,B) KEGG metabolic pathways for combined DEGs and DEMs identification. The abscissa is the ratio of the number of DEMs or DEGs enriched in the pathway to the number of metabolites or genes annotated in the pathway, and the ordinate is the KEGG pathway to which the metabolome and transcriptome are enriched. Count: The number of metabolites or genes enriched in the pathway. The color of the dot represents the p-value of the hypergeometric test, and the smaller the value, the greater the reliability and the more statistically significant the test. (C) The transcriptome and metabolome identified changes in Cutin, suberine, and wax biosynthesis. Gradient colors indicate log2-fold changes (FC) in gene expression in leaves at different time points (2, 4, 12, 24, and 48 h) compared to controls (0 h).
Figure 6
Figure 6
Integrated analysis of differentially expressed genes, proteins, and metabolites in soybean under salt stress. (A,B) DEGs and DEPs combined analysis of enriched GO function and KEGG metabolic pathway. The red color represents upregulation and the blue color represents downregulation, and the horizontal clustering is a clustering of expressions at the proteome and transcriptome levels, i.e., the expression patterns of proteins and genes in a cluster are similar. The gradient color indicates the log2 (FC), Count: the number of proteins and genes enriched in the pathway after stress compared to the control group. (C,D) KEGG metabolic pathways for combined DEPs and DEMs identification. The abscissa is the ratio of the number of DEMs or DEPs enriched in the pathway to the number of metabolites or proteins annotated in the pathway, and the ordinate is the KEGG pathway to which the metabolome and proteome are enriched. Count: The number of metabolites or proteins enriched in the pathway. The color of the dot represents the p-value value of the hypergeometric test, and the smaller the value, the greater the reliability and the more statistically significant the test.
Figure 7
Figure 7
Integrated analysis of differentially expressed genes, proteins, and metabolites in soybean under salt stress. (A,B) KEGG metabolic pathways identified by integrated analysis of DEGs, DEPs, and DEMs (pos, (A); neg, (B)). (C,D) Multiomics analysis identified changes in the carbon-assimilation pathway and amino acids metabolism in photosynthetic organisms (C) and thiamine metabolism pathway (D). Boxes indicate genes, round boxes indicate proteins, and underlined boxes are metabolites. Blue color indicates downregulation, and red color indicates upregulation.
Figure 8
Figure 8
RT-qPCR validation of DEGs. (AF) RT-qPCR validation of DEGs (A). GLYMA_05G202600; (B). GLYMA_14G056300; (C). GLYMA_03G101200; (D). GLYMA_07G139400; (E). GLYMA_12G217400; (F). GLYMA_06G295700. The relative expression levels of genes at different stages of 300 mM NaCl treatment. Each bar represents the average ± SD, n = 3. (t test, n.s.: p > 0.05; *: p ≤ 0.05; **: p ≤ 0.01; ***: p ≤ 0.005; ****: p ≤ 0.001).
Figure 9
Figure 9
Omics analysis of the regulatory mechanism after salt stress in soybean. The first part is the key DEGs identified in transcriptomics, the second part is the key DEPs identified in proteomics, the third part is the DEMs identified in metabolomics, and the fourth part is the significant changes identified in the KEGG metabolic pathway identified by the three omics.

Similar articles

Cited by

References

    1. Kraamwinkel C.T., Beaulieu A., Dias T., Howison R.A. Planetary limits to soil degradation. Commun. Earth Environ. 2021;2:249. doi: 10.1038/s43247-021-00323-3. - DOI
    1. Zörb C., Geilfus C.-M., Dietz K.-J. Salinity and crop yield. Plant Biol. 2019;21:31–38. doi: 10.1111/plb.12884. - DOI - PubMed
    1. Panta S., Flowers T., Lane P., Doyle R., Haros G., Shabala S. Halophyte agriculture: Success stories. Environ. Exp. Bot. 2014;107:71–83. doi: 10.1016/j.envexpbot.2014.05.006. - DOI
    1. Chung Y.S., Kim K.-S., Hamayun M., Kim Y. Silicon Confers Soybean Resistance to Salinity Stress Through Regulation of Reactive Oxygen and Reactive Nitrogen Species. Front. Plant Sci. 2020;10:1725. doi: 10.3389/fpls.2019.01725. - DOI - PMC - PubMed
    1. Daliakopoulos I.N., Tsanis I.K., Koutroulis A., Kourgialas N.N., Varouchakis A.E., Karatzas G.P., Ritsema C.J. The threat of soil salinity: A European scale review. Sci. Total Environ. 2016;573:727–739. doi: 10.1016/j.scitotenv.2016.08.177. - DOI - PubMed

LinkOut - more resources