. 2024 Dec 18;25(24):13564.
doi: 10.3390/ijms252413564.

Essential Role of Cortactin in Myogenic Differentiation: Regulating Actin Dynamics and Myocardin-Related Transcription Factor A-Serum Response Factor (MRTFA-SRF) Signaling

Affiliations

Essential Role of Cortactin in Myogenic Differentiation: Regulating Actin Dynamics and Myocardin-Related Transcription Factor A-Serum Response Factor (MRTFA-SRF) Signaling

Quoc Kiet Ly et al. Int J Mol Sci. .

Abstract

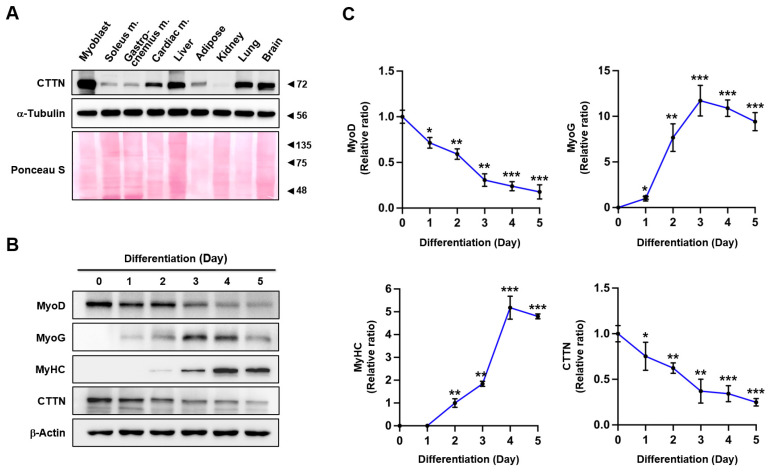
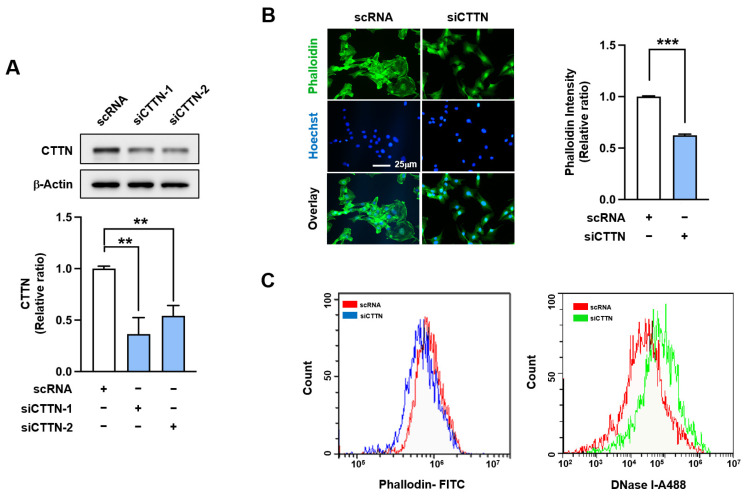
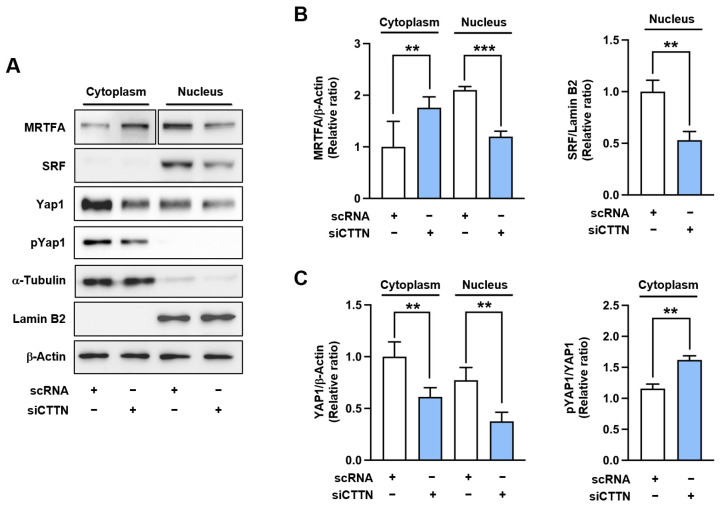
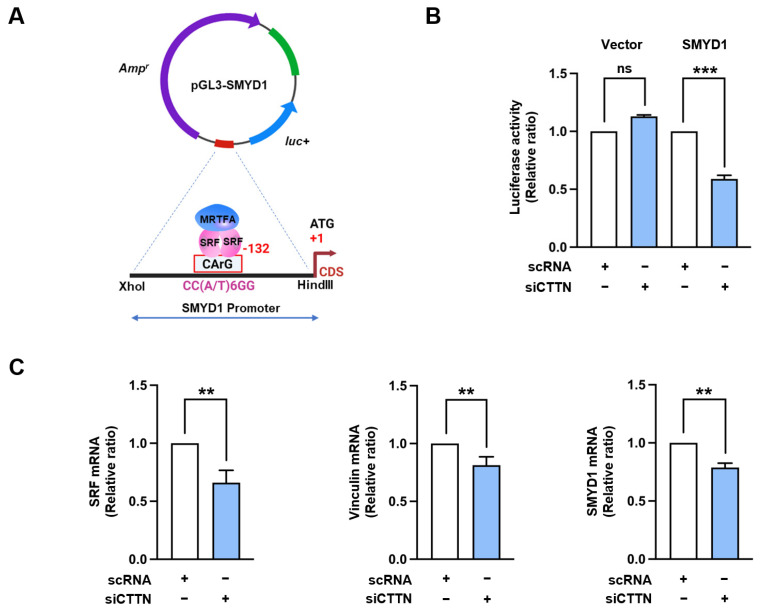
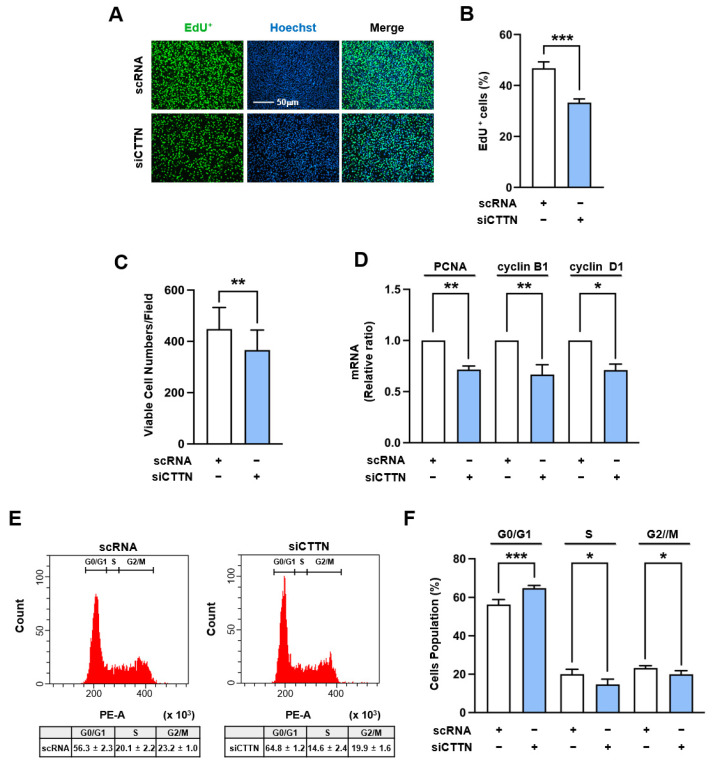
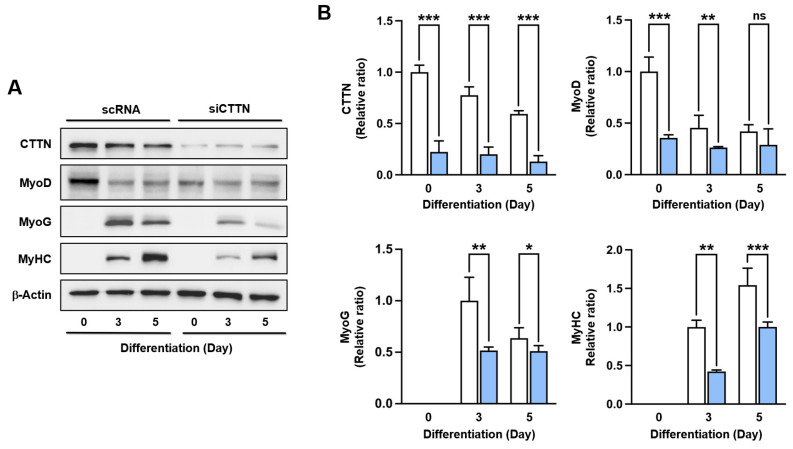
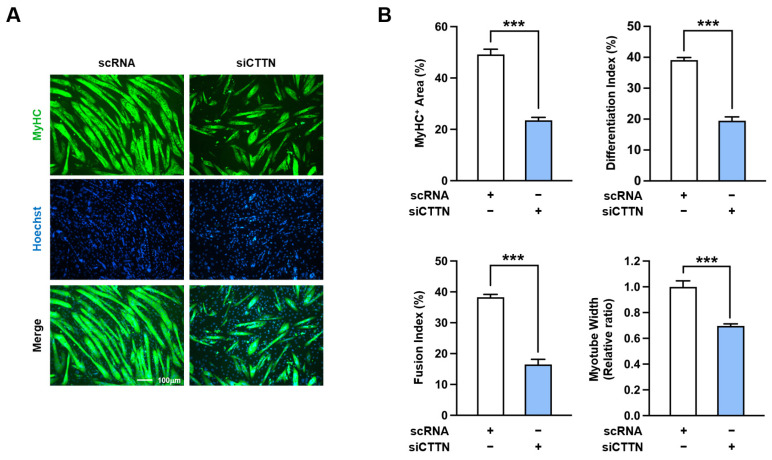
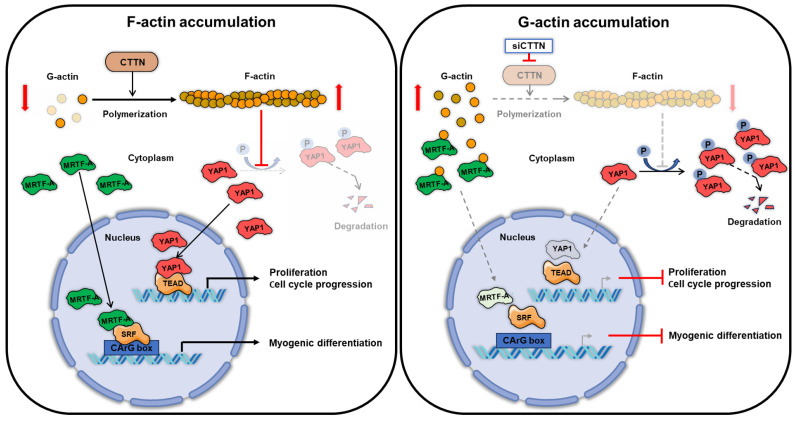
Cortactin (CTTN) is an actin-binding protein regulating actin polymerization and stabilization, which are vital processes for maintaining skeletal muscle homeostasis. Despite the established function of CTTN in actin cytoskeletal dynamics, its role in the myogenic differentiation of progenitor cells remains largely unexplored. In this study, we investigated the role of CTTN in the myogenic differentiation of C2C12 myoblasts by analyzing its effects on actin cytoskeletal remodeling, myocardin-related transcription factor A (MRTFA) nuclear translocation, serum response factor (SRF) activation, expression of myogenic transcription factors, and myotube formation. CTTN expression declined during myogenic differentiation, paralleling the reduction in MyoD, suggesting a potential role in the early stages of myogenesis. We also found that CTTN knockdown in C2C12 myoblasts reduced filamentous actin, enhanced globular actin levels, and inhibited the nuclear translocation of MRTFA, resulting in suppressed SRF activity. This led to the subsequent downregulation of myogenic regulatory factors, such as MyoD and MyoG. Furthermore, CTTN knockdown reduced the nuclear localization of YAP1, a mechanosensitive transcription factor, further supporting its regulatory roles in cell cycle and proliferation. Consequently, CTTN depletion impeded proliferation, differentiation, and myotube formation in C2C12 myoblasts, highlighting its dual role in the coordination of cell cycle regulation and myogenic differentiation of progenitor cells during myogenesis. This study identifies CTTN as an essential regulator of myogenic differentiation via affecting the actin remodeling-MRTFA-SRF signaling axis and cell proliferation.

Keywords: MRTFA; SRF; YAP1; actin remodeling; cortactin; mechanotransduction; myogenic differentiation; proliferation.


Conflict of interest statement

The authors declare no conflicts of interest.

Figures

Figure 1
Figure 1
Modulation of CTTN expression during myoblast differentiation. (A) Immunoblotting was conducted to assess CTTN expression levels in C2C12 myoblasts and various tissues from C57BL/6 mice, with α-tubulin as a loading control. (B) C2C12 myoblasts were harvested on specified differentiation days, and the protein expression levels of MyoD, MyoG, MyHC, and CTTN were analyzed by immunoblotting, with β-actin as a loading control. (C) Protein expression levels were normalized to β-actin, and relative expression ratios were calculated, setting day 0 as one for MyoD and CTTN, day 1 for MyoG, and day 2 for MyHC. Data are presented as means ± SEM (n = 3), with asterisks indicating statistical significance (* p < 0.05, ** p < 0.01, *** p < 0.001).
Figure 2
Figure 2
CTTN knockdown led to a reduction in F-actin levels and an increase in G-actin levels. C2C12 myoblasts were transfected with 200 nM of either control scRNA or siCTTN (siCTTN-1 or siCTTN-2). (A) CTTN expression was assessed by immunoblotting 24 h after transfection. CTTN expression levels were normalized to β-actin, and relative expression ratios were calculated with the control scRNA set to one. (B) After 24 h post-transfection, cells were stained with FITC-phalloidin (green) for F-actin and Hoechst 33,342 (blue) for nuclei. Scale bar: 25 μm. Phalloidin intensities were quantified using ImageJ software, version 1.5.4. (C) F- and G-actin levels were quantified by flow cytometry after staining with FITC-phalloidin for F-actin and DNase I for G-actin, respectively. Data are presented as means ± SEM (n = 3), with asterisks indicating statistical significance (** p < 0.01, *** p < 0.001).
Figure 3
Figure 3
CTTN depletion impaired the nuclear localization of MRTFA and YAP1. C2C12 myoblasts were transfected with either control scRNA or siCTTN and analyzed 24 h post-transfection. (A) Cytoplasmic and nuclear fractions were subjected to immunoblot analysis for MRTFA, SRF, YAP1, pYAP1 (phosphorylated YAP1), and CTTN expression. For MRTFA, different exposure times were used to account for its varied distribution between cytoplasmic and nuclear compartments. α-Tubulin and lamin B2 served as cytoplasmic and nuclear markers, respectively. β-Actin was used as a loading control. (B,C) The protein expression levels were normalized to β-actin, and relative expression ratios were calculated with the control scRNA set to one. Data are presented as means ± SEM (n = 3), with asterisks indicating statistical significance (** p < 0.01, *** p < 0.001).
Figure 4
Figure 4
CTTN knockdown suppressed SRF transcriptional activity. (A) Diagram of the luciferase reporter construct featuring the truncated SMYD1 promoter region, including the CArG box for SRF binding. (B) C2C12 myoblasts were transfected with either the pGL3 vector (Vector) or pGL3 containing the SMYD1 promoter (SMYD1) along with control scRNA or siCTTN. Relative luciferase activity was measured 24 h post-transfection. (C) C2C12 myoblasts were transfected with either control scRNA or siCTTN, and mRNA levels of SRF, Vinculin, and SMYD1 were assessed by RT-qPCR, normalized to GAPDH expression 24 h post-transfection. Data are presented as means ± SEM (n = 3), with asterisks indicating statistical significance (** p < 0.01, *** p < 0.001); ns indicates non-significance.
Figure 5
Figure 5
CTTN depletion impeded cell proliferation and cell cycle progression. C2C12 myoblasts were transfected with either control scRNA or siCTTN and analyzed 24 h post-transfection. (A) Cell proliferation was evaluated by EdU incorporation (green) to label replicating cells, with Hoechst 33,342 (blue) as a nuclear counterstain. Scale bar: 50 µm. (B) The percentage of EdU-positive cells was quantified using ImageJ software. (C) Viable cell numbers were measured using a cell viability assay kit. (D) mRNA levels of proliferation markers (PCNA, cyclin B1, and cyclin D1) were assessed by RT-qPCR and normalized to GAPDH expression. (E,F) Cell cycle analysis was performed using flow cytometry with scatter plots. Data are presented as means ± SEM (n = 3), with asterisks indicating statistical significance (* p < 0.05, ** p < 0.01, *** p < 0.001).
Figure 6
Figure 6
CTTN knockdown suppressed the expression of myogenic regulatory factors. (A) C2C12 myoblasts were transfected with either control scRNA or siCTTN, allowed to differentiate, and then harvested on specified differentiation days. Protein expression levels of MyoD, MyoG, MyHC, and CTTN were analyzed by immunoblotting. (B) Protein expression levels for scRNA (open column) and siCTTN (blue column) were normalized to β-actin and presented as relative ratios, with scRNA expression levels on day 0 (for CTTN and MyoD) or day 3 (for MyoG and MyHC) set to one. Data are presented as means ± SEM (n = 3), with asterisks indicating statistical significance (* p < 0.05, ** p < 0.01, *** p < 0.001); ns indicates non-significance.
Figure 7
Figure 7
CTTN depletion impaired myogenic differentiation. C2C12 myoblasts were transfected with either control scRNA or siCTTN and then allowed to differentiate for 5 days. (A) Representative immunocytochemistry stained with MyHC antibody (green) and Hoechst 33,342 (blue). Scale bar: 100 μm. (B) MyHC-positive areas, differentiation indices, fusion indices, and myotube widths were determined as described in Section 4. Data are presented as means ± SEM (n = 3), with asterisks indicating statistical significance (*** p < 0.001).
Figure 8
Figure 8
Schematic illustration of the actin-MRTFA-SRF and YAP1 signaling pathway regulated by CTTN.

Similar articles

References

    1. Brooks S.V., Guzman S.D., Ruiz L.P. Skeletal muscle structure, physiology, and function. Handb. Clin. Neurol. 2023;195:3–16. doi: 10.1016/B978-0-323-98818-6.00013-3. - DOI - PubMed
    1. Sartori R., Romanello V., Sandri M. Mechanisms of muscle atrophy and hypertrophy: Implications in health and disease. Nat. Commun. 2021;12:330. doi: 10.1038/s41467-020-20123-1. - DOI - PMC - PubMed
    1. Schiaffino S., Dyar K.A., Ciciliot S., Blaauw B., Sandri M. Mechanisms regulating skeletal muscle growth and atrophy. FEBS J. 2013;280:4294–4314. doi: 10.1111/febs.12253. - DOI - PubMed
    1. Chal J., Pourquié O. Making muscle: Skeletal myogenesis in vivo and in vitro. Development. 2017;144:2104–2122. doi: 10.1242/dev.151035. - DOI - PubMed
    1. Feng L.T., Chen Z.N., Bian H. Skeletal muscle: Molecular structure, myogenesis, biological functions, and diseases. MedComm (2020) 2024;5:e649. doi: 10.1002/mco2.649. - DOI - PMC - PubMed

MeSH terms

LinkOut - more resources