. 2024 Dec 18;25(24):13571.
doi: 10.3390/ijms252413571.

BCAT1 Associates with DNA Repair Proteins KU70 and KU80 and Contributes to Regulate DNA Repair in T-Cell Acute Lymphoblastic Leukemia (T-ALL)

Affiliations

BCAT1 Associates with DNA Repair Proteins KU70 and KU80 and Contributes to Regulate DNA Repair in T-Cell Acute Lymphoblastic Leukemia (T-ALL)

Valeria Tosello et al. Int J Mol Sci. .

Abstract

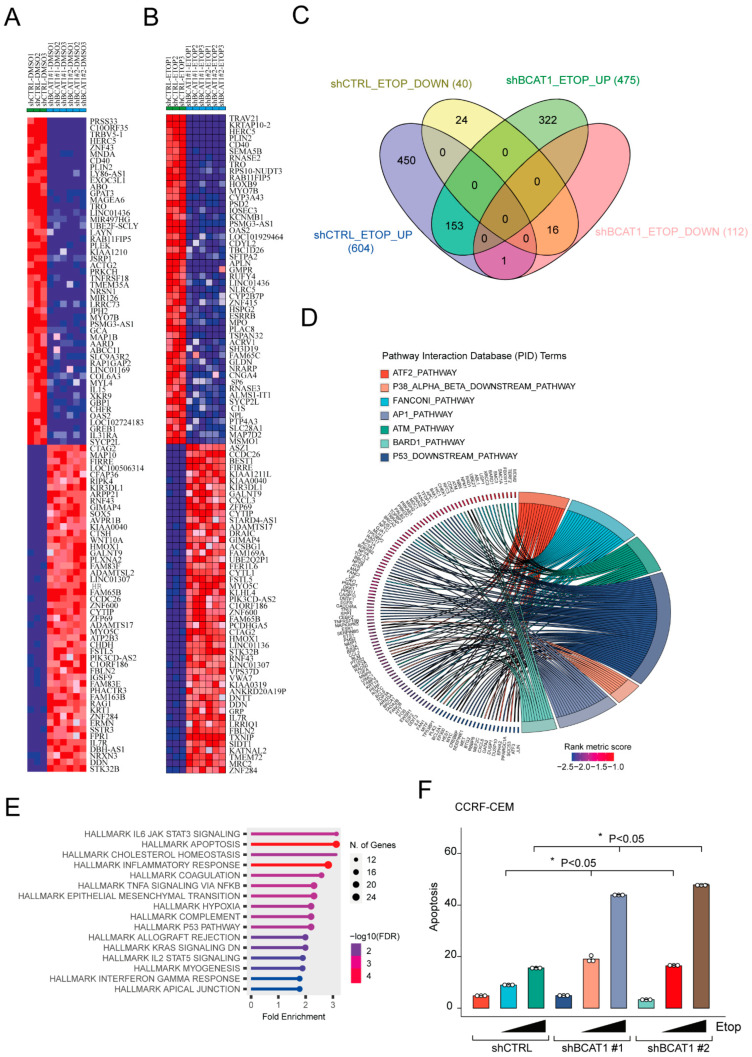
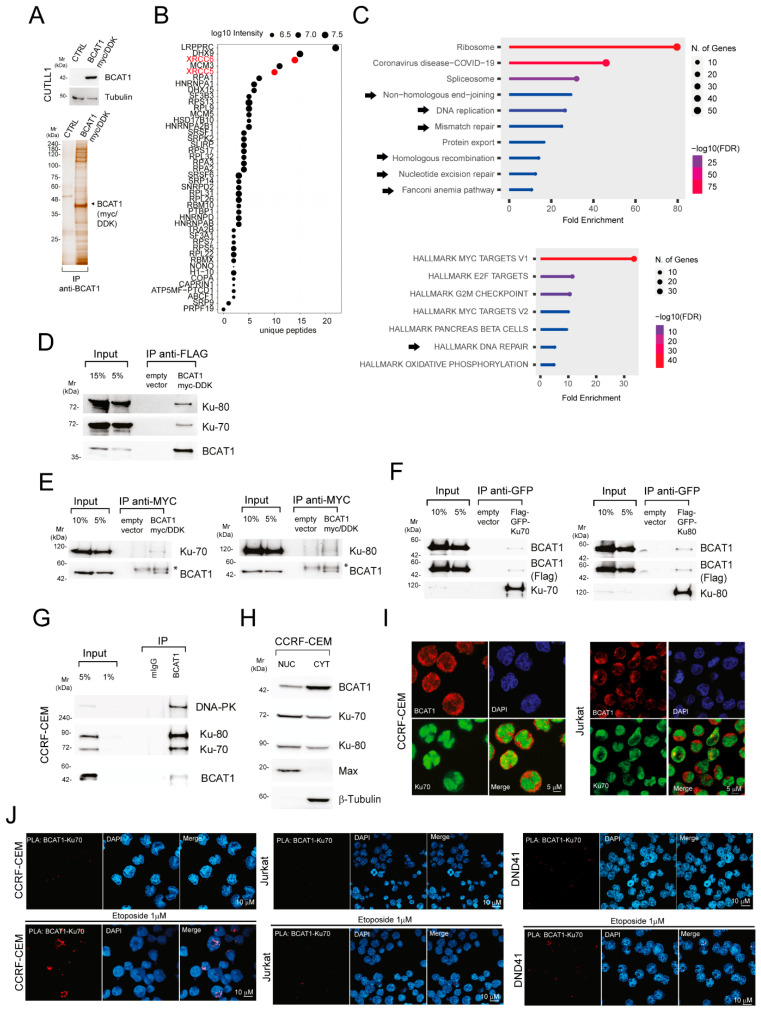
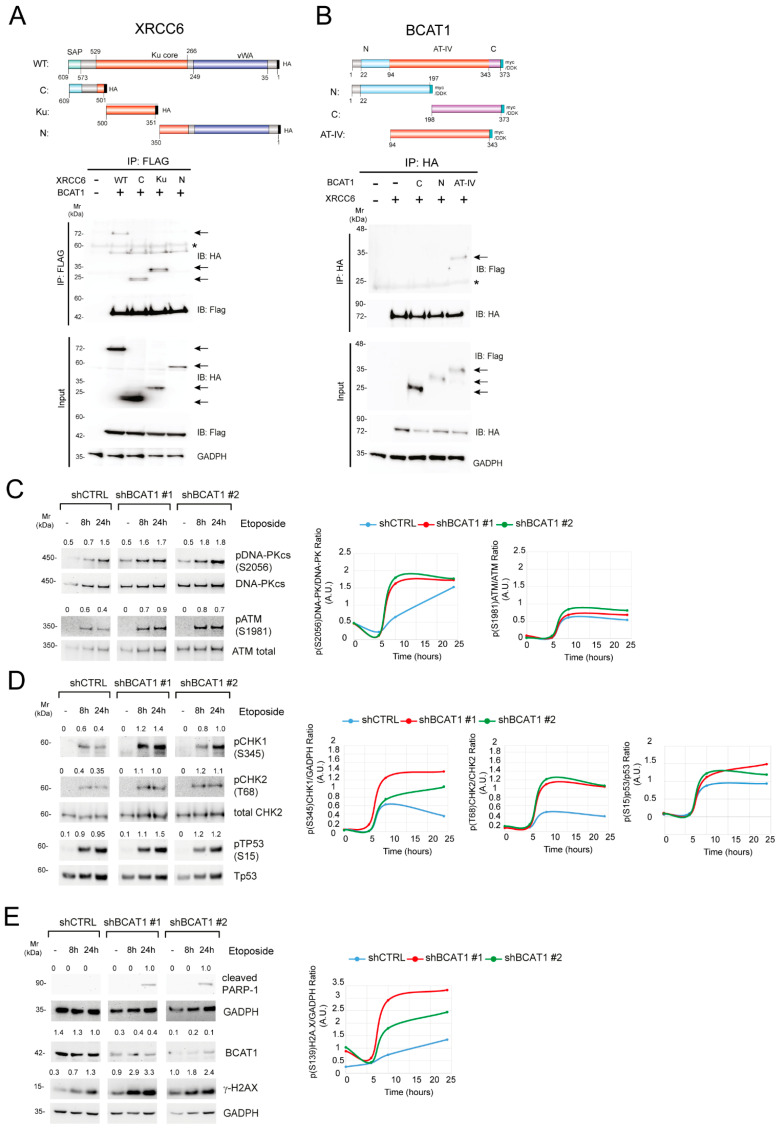
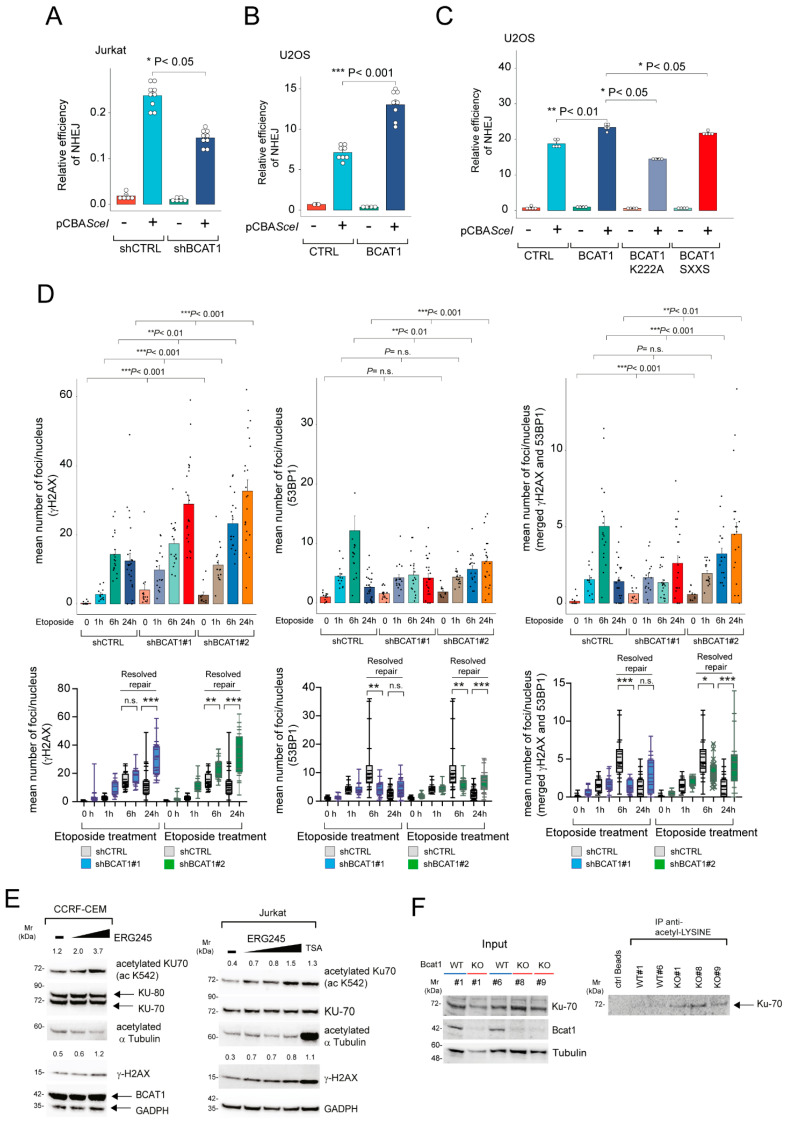
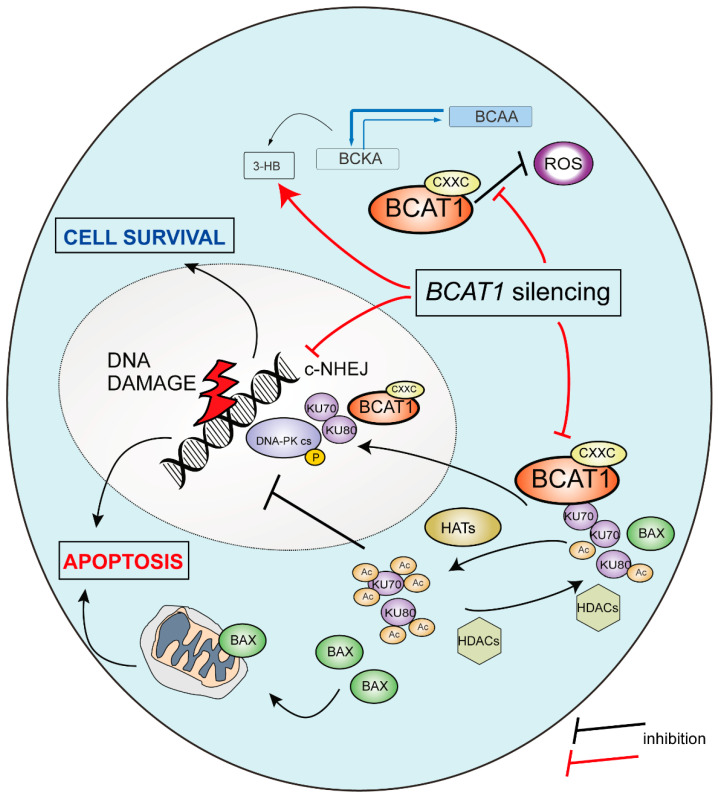
Increased expression of branched-chain amino acid (BCAA) transaminase 1 (BCAT1) often correlates with tumor aggressiveness and drug resistance in cancer. We have recently reported that BCAT1 was overexpressed in a subgroup of T-cell acute lymphoblastic (T-ALL) samples, especially those with NOTCH1 activating mutations. Interestingly, BCAT1-depleted cells showed pronounced sensitivity to DNA-damaging agents such as etoposide; however, how BCAT1 regulates this sensitivity remains uncertain. Here, we provide further clues on its chemo-sensitizing effect. Indeed, BCAT1 protein regulates the non-homologous end joining (c-NHEJ) DNA repair pathway by physically associating with the KU70/KU80 heterodimer. BCAT1 inhibition during active repair of DNA double-strand breaks (DSBs) led to increased KU70/KU80 acetylation and impaired c-NHEJ repair, a dramatic increase in DSBs, and ultimately cell death. Our results suggest that, in T-ALL, BCAT1 possesses non-metabolic functions that confer a drug resistance mechanism and that targeting BCAT1 activity presents a novel strategy to improve chemotherapy response in T-ALL patients.

Keywords: BCAT1; T-cell lymphoblastic leukemia; leukemia growth; metabolism.


Conflict of interest statement

Author Adonia E. Papathanassiu was employed by the company Ergon Pharmaceuticals, LLC. The remaining authors declare that the research was conducted in the absence of any commercial or financial relationships that could be construed as a potential conflict of interest.

Figures

Figure 1
Figure 1
BCAT1 loss induces a dysfunctional DNA damage response following etoposide treatment. (A) Heat map representation of the top down- and upregulated genes between control CCRF-CEM (shCTRL) and BCAT1-depleted CCRF-CEM cells (shBCAT1 #1 and #2). (B) Heat map representation of the top down– and upregulated genes between CCRF–CEM shCTRL treated with etoposide for 24 h and CCRF-CEM shBCAT1 treated with etoposide for 24 h. (C) Venn diagram comparing number of transcripts significantly up- (UP) or downregulated (DOWN) by etoposide treatment in each dataset. (D,E) ShinyGO 0.8 software was used for enrichment analysis of differentially expressed genes between control and BCAT1−depleted cells treated with etoposide. Gene set enrichment analysis (GSEA) identified significantly enriched Pathway Interaction Database (PID) and hallmark gene sets. (D) The chord plot shows the relationship between PID gene sets and genes. (E) Lollipop plots showing enriched hallmark gene sets. (F) Quantification of apoptosis in CCRF-CEM T-ALL cells transduced with shCTRL or shBCAT1 and treated in vitro for 48 h with DMSO (vehicle) or etoposide (500 nM–1 μM). Significance was calculated using the Kruskal-Wallis test. * p < 0.05.
Figure 2
Figure 2
BCAT1 interacts with KU70 and KU80 proteins. (A) Purification of BCAT1 interacting partners. Expression of BCAT1 and tubulin was analyzed by immunoblotting (top) in CUTLL1 T-ALL cells stably expressing empty vector or double epitope-tagged BCAT1 (myc/DDK). Cytoplasmic extracts prepared from BCAT1 myc/DDK-expressing or mock-transduced (CTRL) CUTLL1 cells were subjected to sequential immunoprecipitation (IP) using anti-FLAG and anti-MYC beads. Proteins were resolved by SDS-PAGE and visualized by silver staining (bottom). Molecular weights (Mr) are indicated on the left. (B) Top proteins interacting with BCAT1 identified by mass spectrometry based on the number of unique peptides and intensity (bubble plot). These proteins were not identified in the control IP. Results are from one experiment of two performed with similar results. (C) ShinyGO 0.8 software was used for enrichment analysis of BCAT1-interacting partners. KEGG pathway (top) and hallmark (bottom) analysis representing top significantly enriched pathways (lollipop plots). (D) Cytoplasmic extracts prepared from CUTLL1 T-ALL cells stably expressing empty vector or BCAT1 myc/DDK were subjected to IP using anti-FLAG beads. FLAG peptide was used to elute proteins from the beads and were resolved by SDS-PAGE. Immunoblotting for BCAT1, KU70, and KU80 proteins was performed. (E) HEK 293T cells stably expressing epitope-tagged BCAT1 were transfected with GFP-KU70 (left) or GFP-KU80 (right) expression vectors, and lysates were subjected to co-immunoprecipitation (Co-IP) using anti-MYC tag beads. Immunoblot analysis for BCAT1 (anti-BCAT1) and KU70 or KU80 (anti-GFP) was performed. Asterisk (*) indicates non-specific bands. (F) HEK 293T cells stably expressing epitope-tagged BCAT1 were transfected with GFP-KU70 (left) or GFP-KU80 (right) expression vectors, and lysates were subjected to Co-IP using anti-GFP beads. Immunoblot analysis for BCAT1 (anti-BCAT1 and anti-Flag) and KU70 or KU80 (anti-GFP) was performed. (G) Interaction between endogenously expressed BCAT1, KU70, and KU80 proteins in CCRF-CEM cells was demonstrated by IP with IgG (mIgG) and anti-BCAT1 antibody followed by immunoblot analysis with the indicated antibodies. DNA-PKcs was also detected. (H) Cellular localization analysis of BCAT1, KU70, and KU80 via Western blot analysis of nuclear and cytoplasmic cell fractions in cell lysates from CCRF-CEM T-ALL cells. Tubulin and Max proteins are shown as controls for cytosolic and nuclear fractions. CYT: cytoplasmic fraction; NUC: nuclear fraction. (I) Localization of BCAT1 (red) and KU70 (green) by immunofluorescence in CCRF-CEM and Jurkat T-ALL cells. DAPI (blue) was used as a nuclear marker. A scale bar is shown. (J) The interaction between BCAT1 and KU70 was assessed under basal conditions (top) and after 24 h of treatment with etoposide (1 µM; bottom) by proximity ligation assay (PLA) with the indicated pairs of primary antibodies. DAPI (blue) was used as a nuclear marker. Scale bar is shown.
Figure 3
Figure 3
BCAT1–depletion induces a dysfunctional DNA damage response following etoposide treatment. (A) Schematic representations of the plasmids encoding full-length (WT) and truncation mutants of XRCC6 (top). vWA: von Willebrand A domain; SAP: SAF-A/B, Acinus, and PIAS domain. HEK 293T cells stably expressing epitope-tagged BCAT1 were transfected with the indicated plasmid. Cell lysates were subjected to IP with anti-FLAG beads followed by immunoblot analysis with the indicated antibodies. The arrows indicate expected positions of the respective proteins, and asterisks (*) indicate non–specific bands. (B) Schematic representations of the plasmids encoding full-length (WT) and truncation mutants of BCAT1 (top). N: Branched–chain amino acid aminotransferase-like N-terminal domain; AT–IV: aminotransferase class IV domain; C: Branched-chain amino acid aminotransferase-like C–terminal domain. HEK 293T cells were transfected with HA–tagged XRCC6 and the indicated BCAT1 mutant plasmids. Cell lysates were subjected to IP with anti-HA beads followed by immunoblot analysis with the indicated antibodies. The arrows indicate expected positions of the respective proteins, and asterisks (*) indicate non-specific bands. (CE) CCRF–CEM T-ALL cells transduced with shCTRL or shBCAT1 were treated with 1 µM etoposide for the indicated time. Subsequently, whole cell lysates were collected and analyzed by immunoblotting for proteins implicated in (C,D) the activation of the DNA damage response (pDNA-PKcs, pATM, pCHK1, pCHK2, pTP53); (E) DNA damage (γH2AX) and apoptosis (cleaved PARP-1). Total DNA–PKcs and ATM are shown as loading controls (C). Total CHK2, total TP53, and GADPH are shown as loading controls (D,E). Phospho-protein/protein ratios are shown (top) in each panel. A graphical representation of the phospho-protein/protein ratios is also shown for selected proteins (right panels).
Figure 4
Figure 4
BCAT1-depletion decreases DNA repair by modulating KU70 acetylation levels. (A) Jurkat reporter cell lines were generated from parental cell lines by transfection of the pimEJ5-GFP construct and subsequent selection with puromycin for over 14 days. These cell lines were subsequently engineered to lose BCAT1 expression (pLKO.1 shBCAT1#3). The reporter cell lines were then electroporated with the pCBA-SceI endonuclease-expressing vector (or empty vector). After 72 h, the activity of the c-NHEJ (pimEJ5-GFP vector-expressing cells) DNA repair pathway was assessed by measuring the percentage of GFP-positive cells using flow cytometry. Error bars indicate ±SD. Results from one of three independent experiments performed with 6–9 replicates are shown. Significance was calculated using an unpaired Mann–Whitney U test. * p < 0.05. (B) U2OS cells were engineered to overexpress BCAT1 (BCAT1 myc/DDK). Cells were then transfected with the pimEJ5-GFP vector and pCBA-SceI or empty vector. After 48 h, the activity of the c-NHEJ (pimEJ5–GFP vector-expressing cells) DNA repair pathway was assessed by measuring the percentage of GFP-positive cells using flow cytometry. Error bars indicate ± SD. Results from one of two independent experiments are shown. Significance was calculated using an unpaired Mann-Whitney U test. *** p < 0.001. (C) U2OS cells were engineered to overexpress BCAT1 (BCAT1 myc/DDK) or BCAT1 mutants (K222A, SXXS). Cells were then transfected with the pimEJ5-GFP vector and pCBA-SceI or empty vector. After 48 h, the activity of the c-NHEJ (pimEJ5–GFP vector-expressing cells) DNA repair pathway was assessed by measuring the percentage of GFP–positive cells using flow cytometry. Error bars indicate ± SD. Results from one of two independent experiments are shown. Significance was calculated using an unpaired Mann-Whitney U test. * p < 0.05, ** p < 0.01. (D) Kinetics of DNA repair in CCRF-CEM control and BCAT1 stable knockdown T-ALL cells (shBCAT1#1, shBCAT1#2). The number of γH2AX foci (left), 53BP1 foci (middle), and coincident γH2AX/53BP1 foci (right) per nucleus following etoposide treatment are denoted. Each point represents data from a single cell, and the bars denote the median foci number per cell. Top panels: Significance was calculated using the Kruskal-Wallis test. ** p < 0.01, *** p < 0.001. n.s. = not significant. Box–and–whisker plots denote expression from minimum to maximum (bottom). Significance was calculated using an unpaired Mann-Whitney U test. ** p < 0.01, *** p < 0.001. n.s. = not significant. (E) CCRF-CEM T-ALL cells (left) were treated with different doses of ERG245 (100–200 µM) for 24 h. Subsequently, whole cell lysates were collected and analyzed by immunoblotting for the indicated proteins. Total KU70 and GADPH are shown as loading controls. Jurkat T-ALL cells (right) were treated with different doses of ERG245 (100–300 µM) or Trichostatin A (TSA; 100 nM) for 24 h. Subsequently, whole cell lysates were collected and analyzed by immunoblotting for the indicated proteins. Total KU70 and GADPH are shown as loading controls. The acetylated KU70/total KU70 protein ratios and γH2AX/GADPH protein ratios are also shown. (F) Whole cell lysates from ΔE-NOTCH1 leukemias wild-type and KO for Bcat1 were immunoprecipitated using anti-acetyl-lysine affinity beads or control beads and probed for Ku70 and Bcat1. α-Tubulin is shown as a loading control (input).
Figure 5
Figure 5
Schematic illustration of a proposed model for BCAT1 in modulating the DNA damage response in T-ALL cells. 3-HB: 3 hydroxy-butyrate; BCAA: branched-chain amino acids; BCKA: branched-chain keto acids; ROS: reactive oxygen species; HATs: histone acetyl transferases; HDACs: histone deacetylases; c-NHEJ: non-homologous end joining. The CXXC motif of BCAT1 implicated in ROS buffering is also shown.

References

    1. Terwilliger T., Abdul-Hay M. Acute lymphoblastic leukemia: A comprehensive review and 2017 update. Blood Cancer J. 2017;7:e577. doi: 10.1038/bcj.2017.53. - DOI - PMC - PubMed
    1. Pui C.H., Robison L.L., Look A.T. Acute lymphoblastic leukaemia. Lancet. 2008;371:1030–1043. doi: 10.1016/S0140-6736(08)60457-2. - DOI - PubMed
    1. Belver L., Ferrando A. The genetics and mechanisms of T cell acute lymphoblastic leukaemia. Nat. Rev. Cancer. 2016;16:494–507. doi: 10.1038/nrc.2016.63. - DOI - PubMed
    1. Bongiovanni D., Saccomani V., Piovan E. Aberrant Signaling Pathways in T-Cell Acute Lymphoblastic Leukemia. Int. J. Mol. Sci. 2017;18:1904. doi: 10.3390/ijms18091904. - DOI - PMC - PubMed
    1. Weng A.P., Ferrando A.A., Lee W., Morris J.P.t., Silverman L.B., Sanchez-Irizarry C., Blacklow S.C., Look A.T., Aster J.C. Activating mutations of NOTCH1 in human T cell acute lymphoblastic leukemia. Science. 2004;306:269–271. doi: 10.1126/science.1102160. - DOI - PubMed

MeSH terms

LinkOut - more resources