

Extended Photoperiod Facilitated the Restoration of the Expression of GH-IGF Axis Genes in Submerged Rainbow Trout (Oncorhynchus mykiss)
- PMID: 39769354
- PMCID: PMC11679508
- DOI: 10.3390/ijms252413583
Extended Photoperiod Facilitated the Restoration of the Expression of GH-IGF Axis Genes in Submerged Rainbow Trout (Oncorhynchus mykiss)
Abstract
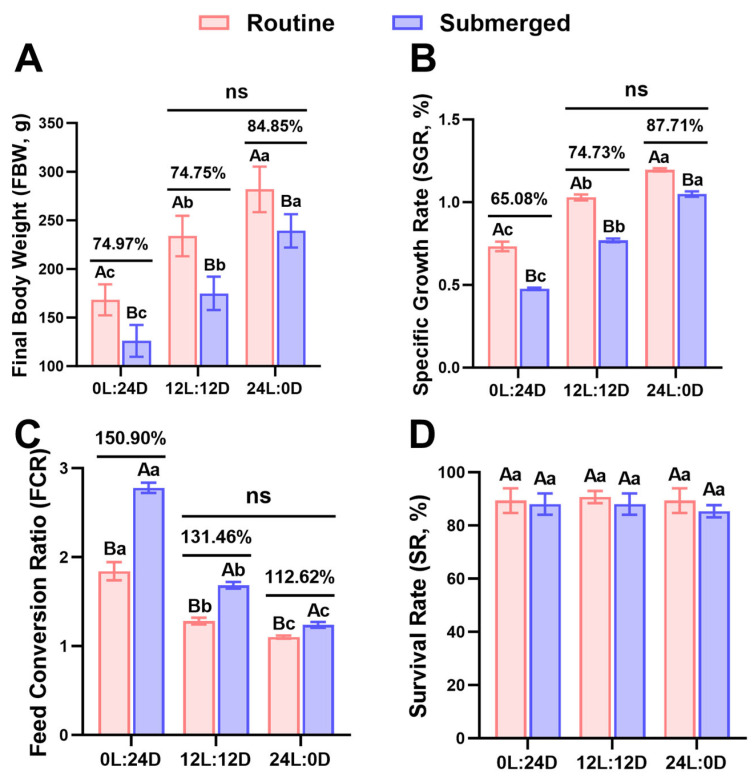
Salmonids, classified as physostomous fish, maintain buoyancy by ingesting air to inflate their swim bladders. Long-term submergence has been shown to cause body imbalance and reduced growth performance in these fish. Previous studies have demonstrated that extended photoperiod can promote growth in salmonids. This study aimed to investigate the regulatory effects of prolonged lighting on the growth of submerged rainbow trout (Oncorhynchus mykiss) by examining the transcriptional expression of genes in the growth hormone (GH)-insulin-like growth factor (IGF) axis. Rainbow trout were individually reared in one of the six environments, defined by the combination of three photoperiods (0L:24D, 12L:12D, and 24L:0D) and two spatial rearing modes (routine and submerged), for 16 weeks. We compared the growth performance of rainbow trout in different environments and further analyzed the transcription profiles and correlations of GH-IGF axis genes in the brain, liver, and muscle. The findings of this study were as follows: growth performance of rainbow trout gradually increased with photoperiod duration. Specifically, final body weight (FBW) and specific growth rate (SGR) increased, while feed conversion ratio (FCR) decreased. Extended photoperiod partially mitigated the adverse effects of long-term submergence on rainbow trout growth. Under 24L:0D photoperiod conditions, growth performance (FBW, SGR, and FCR) in submerged and routine rainbow trout was more closely aligned compared to 0L:24D and 12L:12D photoperiod conditions. In response to variations in the photoperiod, GH-IGF axis genes of rainbow trout exhibited significant transcriptional differences, particularly between treatments with 0L:24D and 24L:0D light exposure. An extended photoperiod facilitated the restoration of the expression of GH-IGF axis genes in submerged rainbow trout towards routine levels, including the up-regulation of sst and sstr2 genes in the brain. Correlation analysis implied differentiation of physiological functions of ghr and igfbp paralogs. This study provided insights into the feasibility of enhancing the growth performance of submerged salmonids through photoperiod manipulation.
Keywords: GH-IGF axis; growth; photoperiod; submerged rainbow trout.
Conflict of interest statement
The authors declare no conflicts of interest. The funders had no role in the design of the study; in the collection, analyses, or interpretation of data; in the writing of the manuscript; or in the decision to publish the results.
Figures


Similar articles
-
GHRH-SST-GH-IGF axis regulates crosstalk between growth and immunity in rainbow trout (Oncorhynchus mykiss) infected with Vibrio anguillarum.Fish Shellfish Immunol. 2020 Nov;106:887-897. doi: 10.1016/j.fsi.2020.08.037. Epub 2020 Aug 29. Fish Shellfish Immunol. 2020. PMID: 32866610
-
Role of the GH-IGF-1 system in Atlantic salmon and rainbow trout postsmolts at elevated water temperature.Comp Biochem Physiol A Mol Integr Physiol. 2015 Oct;188:127-38. doi: 10.1016/j.cbpa.2015.06.030. Epub 2015 Jul 3. Comp Biochem Physiol A Mol Integr Physiol. 2015. PMID: 26144599
-
Effects of artificial photoperiods on antigen-dependent immune responses in rainbow trout (Oncorhynchus mykiss).Fish Shellfish Immunol. 2023 Jun;137:108759. doi: 10.1016/j.fsi.2023.108759. Epub 2023 Apr 23. Fish Shellfish Immunol. 2023. PMID: 37088347
-
Profiling growth performance, insulin-like growth factors, and IGF-binding proteins in rainbow trout lacking IGFBP-2b.Am J Physiol Regul Integr Comp Physiol. 2025 Jan 1;328(1):R34-R44. doi: 10.1152/ajpregu.00209.2024. Epub 2024 Oct 14. Am J Physiol Regul Integr Comp Physiol. 2025. PMID: 39401484
-
Peripheral regulation of the growth hormone-insulin-like growth factor system in fish and other vertebrates.Comp Biochem Physiol A Mol Integr Physiol. 2012 Nov;163(3-4):231-45. doi: 10.1016/j.cbpa.2012.08.003. Epub 2012 Aug 14. Comp Biochem Physiol A Mol Integr Physiol. 2012. PMID: 22909791 Review.
References
-
- Mills D., Crawford L.M. Salmonids. In: Cochran J.K., Bokuniewicz H.J., Yager P.L., editors. Encyclopedia of Ocean Sciences. 3rd ed. Volume 2. Academic Press; Oxford, UK: 2019. pp. 297–306. - DOI
-
- Moxness Reksten A., Ho Q.T., Nøstbakken O.J., Wik Markhus M., Kjellevold M., Bøkevoll A., Hannisdal R., Frøyland L., Madsen L., Dahl L. Temporal variations in the nutrient content of Norwegian farmed Atlantic salmon (Salmo salar), 2005–2020. Food Chem. 2022;373:131445. doi: 10.1016/j.foodchem.2021.131445. - DOI - PubMed
-
- Jensen I.J., Mæhre H.K., Tømmerås S., Eilertsen K.E., Olsen R.L., Elvevoll E.O. Farmed Atlantic salmon (Salmo salar L.) is a good source of long chain omega-3 fatty acids. Nutr. Bull. 2012;37:25–29. doi: 10.1111/j.1467-3010.2011.01941.x. - DOI
MeSH terms
Substances
Grants and funding
LinkOut - more resources
Full Text Sources
