. 2024 Dec 19;25(24):13604.
doi: 10.3390/ijms252413604.

Characterization of Dendritic Cells and Myeloid-Derived Suppressor Cells Expressing Major Histocompatibility Complex Class II in Secondary Lymphoid Organs in Systemic Lupus Erythematosus-Prone Mice

Affiliations

Characterization of Dendritic Cells and Myeloid-Derived Suppressor Cells Expressing Major Histocompatibility Complex Class II in Secondary Lymphoid Organs in Systemic Lupus Erythematosus-Prone Mice

Felipe R Uribe et al. Int J Mol Sci. .

Abstract

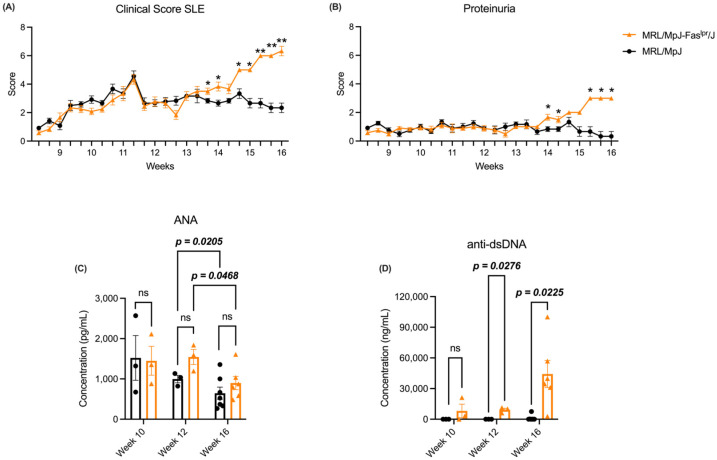
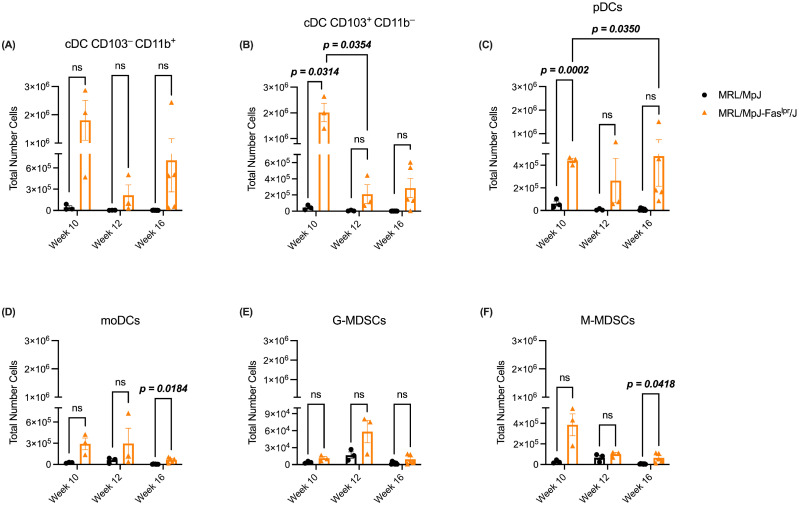
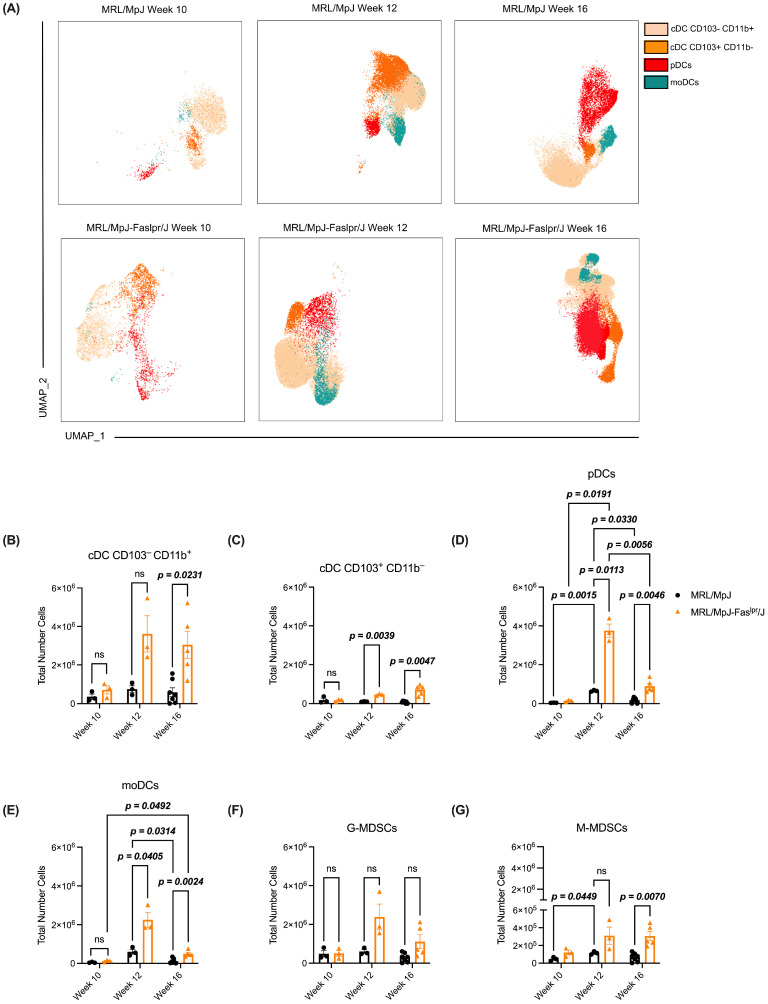
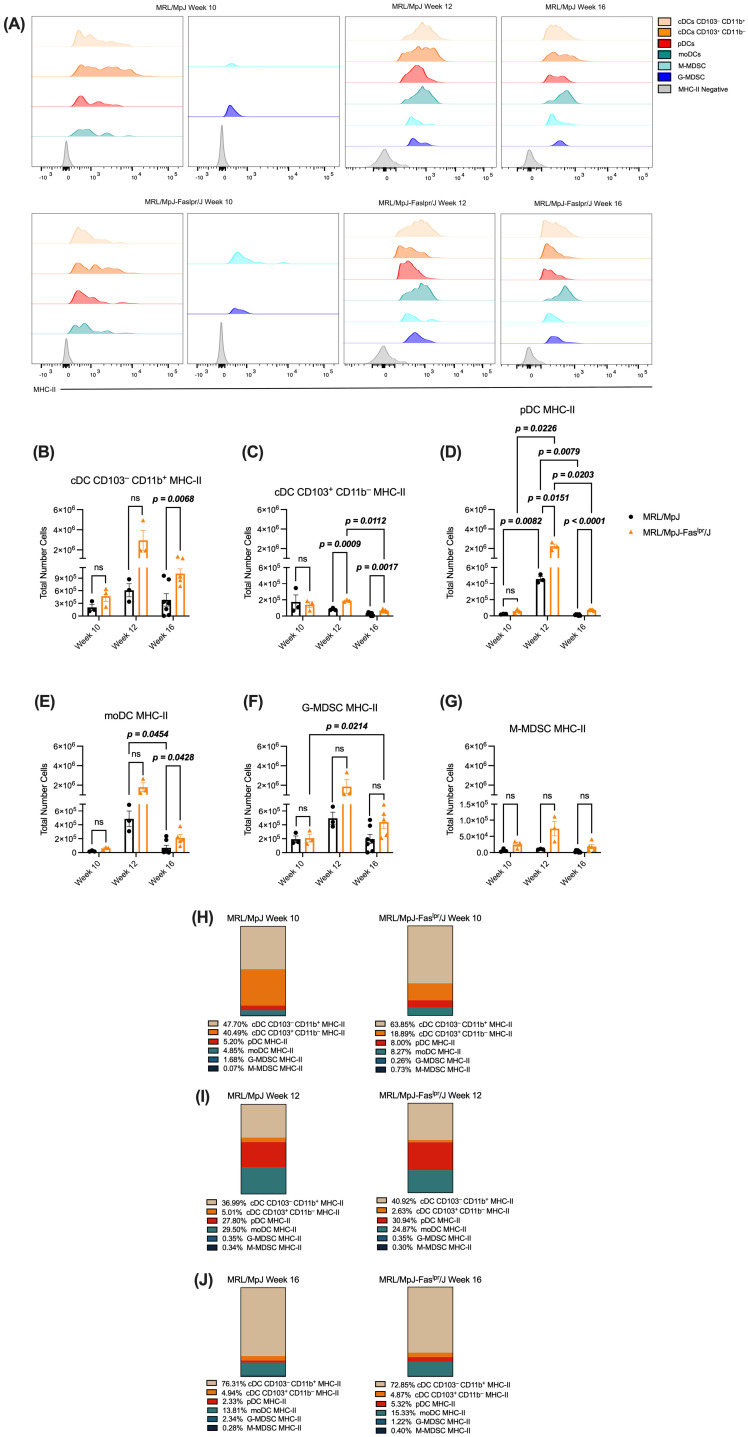
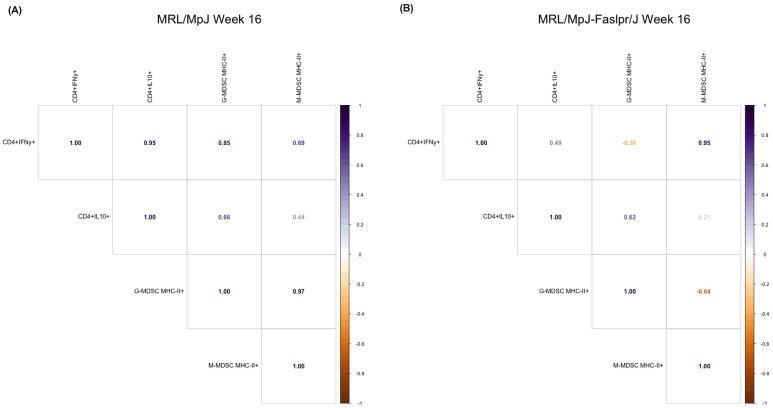
Systemic lupus erythematosus (SLE) is an autoimmune disease characterized by self-antibody production and widespread inflammation affecting various body tissues. This disease is driven by the breakdown of immune tolerance, which promotes the activation of autoreactive B and T cells. A key feature of SLE is dysregulation in antigen presentation, where antigen-presenting cells (APCs) play a central role in perpetuating immune responses. Dendritic cells (DCs) are highly specialized for antigen presentation among APCs. At the same time, myeloid-derived suppressor cells (MDSCs) can also express MHC-II molecules, although their role in SLE is less understood. Utilizing the SLE model, MRL/MpJ-Faslpr/J, we determined the presence of different phenotypes of DCs and MDSCs expressing MHC-II in secondary lymphoid organs, along with the gene expression of ICOSL, CD80 and CD86 in the spleen. Our study determined that the most abundant population of APCs in secondary lymphoid organs corresponds to cDC CD103-CD11b+ MHC-II+ throughout SLE development. Additionally, ICOSL expression increased over time, becoming more preponderant in week 16 in the SLE model, which could indicate that it is a crucial pathway for the development and progression of the pathology. In week 16, we observed a positive correlation between M-MDSC MHC-II and IFN-γ-producing CD4+ T cells.

Keywords: MRL/MpJ-Faslpr/J; co-stimulatory molecules; dendritic cells (DCs); innate immunity; major histocompatibility complex class II (MHC-II); myeloid-derived suppressor cells (MDSCs); systemic lupus erythematosus (SLE).


Conflict of interest statement

The authors declare no conflicts of interest.

Figures

Figure 1
Figure 1
The MRL/MpJ-Faslpr/J model did not present variations in ANA levels. However, clinical score, proteinuria, and anti-dsDNA antibody concentrations increased throughout the study. Physical and biochemical parameters were evaluated to determine the clinical score, proteinuria, and self-antibody concentration. (A) Clinical score and (B) proteinuria were measured throughout the SLE development. MRL/MpJ (black circles) and MRL/MpJ-Faslpr/J (orange triangles). The statistical analysis utilized was a two-way ANOVA post-Tukey’s test, * p < 0.05 and ** p < 0.01. (C) ANA and (D) anti-dsDNA antibody concentration from week 10 to week 16. MRL/MpJ (black circles) and MRL/MpJ-Faslpr/J (orange triangle). MRL/MpJ week 10 (n = 3), MRL/MpJ-Faslpr/J week 10 (n = 3), MRL/MpJ week 12 (n = 3), MRL/MpJ-Faslpr/J week 12 (n = 3), MRL/MpJ week 16 (n = 7), MRL/MpJ-Faslpr/J week 16 (n = 6). The statistical analysis used was a two-way ANOVA post-Tukey’s test, p < 0.05 (bold), “ns” indicated not significant.
Figure 2
Figure 2
cDC CD103+CD11b and pDCs increased in axillary lymph nodes in the SLE model at week 10, whereas moDCs and M-MDSCs increased later in our study. The abundance of DCs and MDSCs throughout the pathology was analyzed from the axillary lymph nodes of both murine models. A total number of (A) cDC CD103CD11b+, (B) cDC CD103+CD11b, (C) pDCs, (D) moDCs, (E) G-MDSCs, and (F) M-MDSCs in the different weeks of the study. MRL/MpJ (black circles) and MRL/MpJ-Faslpr/J (orange triangle). MRL/MpJ week 10 (n = 3), MRL/MpJ-Faslpr/J week 10 (n = 3), MRL/MpJ week 12 (n = 3), MRL/MpJ-Faslpr/J week 12 (n = 3), MRL/MpJ week 16 (n = 7), MRL/MpJ-Faslpr/J week 16 (n = 5). The statistical analysis used was a two-way ANOVA, post Tukey’s test. p < 0.05 (bold), “ns” indicated not significant.
Figure 3
Figure 3
The different phenotypes of DCs increased between weeks 12 and 16 in the spleen of the SLE model. Meanwhile, M-MDSCs presented this behavior in week 16. The abundance of DCs and MDSCs throughout the pathology was analyzed from the spleens of both murine models. (A) UMAP represents the behavior of cDC CD103CD11b+ (beige), cDC CD103+CD11b (orange), pDCs (red), and moDCs (green) in the clusters throughout the different weeks in both experimental groups. A total number of (B) cDC CD103CD11b+, (C) cDC CD103+CD11b, (D) pDCs, (E) moDCs, (F) G-MDSCs, and (G) M-MDSCs at the different points of the study (weeks 10, 12, and 16). MRL/MpJ (black circles) and MRL/MpJ-Faslpr/J (orange triangle). MRL/MpJ week 10 (n = 3), MRL/MpJ-Faslpr/J week 10 (n = 3), MRL/MpJ week 12 (n = 3), MRL/MpJ-Faslpr/J week 12 (n = 3), MRL/MpJ week 16 (n = 7), MRL/MpJ-Faslpr/J week 16 (n = 5). The statistical analysis used was a two-way ANOVA post-Tukey’s test, p < 0.05 (bold), “ns” indicated not significant.
Figure 4
Figure 4
The number of cDC CD103CD11b+ MHC-II+ during week 16 increased in SLE and was positioned as the most representative population across weeks in the MRL/MpJ-Faslpr/J model. The abundance of DCs and MDSCs expressing MHC-II throughout the pathology was analyzed from the spleens of both murine models. (A) Histograms corresponding to MHC-II in the different weeks in each of the immune populations analyzed. MHC-II negative (gray), cDC CD103CD11b+ (beige), cDC CD103+CD11b (orange), pDCs (red), moDCs (green), G-MDSCs (blue), and M-MDSCs (sky blue). The histogram for week 10 is divided into a left panel based on the BV605 fluorochrome and a right panel based on the PerCP-Cy5.5 fluorochrome. The histograms for the weeks are also based on the PerCP-Cy5.5 fluorochrome. A total number of (B) cDC CD103CD11b+, (C) cDC CD103+CD11b, (D) pDCs, (E) moDCs, (F) G-MDSCs, and (G) M-MDSCs expressing MHC-II at the different points of the study. MRL/MpJ (black circles) and MRL/MpJ-Faslpr/J (orange triangle). MRL/MpJ week 10 (n = 3), MRL/MpJ-Faslpr/J week 10 (n = 3), MRL/MpJ week 12 (n = 3), MRL/MpJ-Faslpr/J week 12 (n = 3), MRL/MpJ week 16 (n = 7), MRL/MpJ-Faslpr/J week 16 (n = 5). The statistical analysis used was a two-way ANOVA post-Tukey’s test, p < 0.05 (bold), “ns” indicated not significant. (HJ) Population abundance of DCs and MDSCs expressing MHC-II in the spleen during weeks 10, 12, and 16, respectively.
Figure 5
Figure 5
M-MDSC MHC-II positively correlated with IFN-γ-producing CD4+ T cells at week 16 from the spleen of the MRL/MpJ-Faslpr/J model. Based on the total number of CD4+ T cells and MDSCs expressing MHC-II obtained from the spleen, a correlation was performed at week 16. This analysis assessed the correlation between MDSCs expressing MHC-II concerning IFN-γ- and IL-10-producing CD4+ T cells in the (A) MRL/MpJ and (B) MRL/MpJ-Faslpr/J groups. The values indicate the trend between the cell populations considered. Purple indicates a positive correlation, while orange indicates a negative correlation. MRL/MpJ (n = 3), MRL/MpJ-Faslpr/J (n = 3). The statistical analysis used was a Pearson correlation.

Similar articles

References

    1. Fortuna G., Brennan M.T. Systemic Lupus Erythematosus. Dent. Clin. N. Am. 2013;57:631–655. doi: 10.1016/j.cden.2013.06.003. - DOI - PubMed
    1. Barber M.R.W., Falasinnu T., Ramsey-Goldman R., Clarke A.E. The Global Epidemiology of SLE: Narrowing the Knowledge Gaps. Rheumatology. 2023;62:i4–i9. doi: 10.1093/rheumatology/keac610. - DOI - PMC - PubMed
    1. Ameer M.A., Chaudhry H., Mushtaq J., Khan O.S., Babar M., Hashim T., Zeb S., Tariq M.A., Patlolla S.R., Ali J., et al. An Overview of Systemic Lupus Erythematosus (SLE) Pathogenesis, Classification, and Management. Cureus. 2022;14:e30330. doi: 10.7759/cureus.30330. - DOI - PMC - PubMed
    1. Crow M.K. Pathogenesis of Systemic Lupus Erythematosus: Risks, Mechanisms and Therapeutic Targets. Ann. Rheum. Dis. 2023;82:999–1014. doi: 10.1136/ard-2022-223741. - DOI - PubMed
    1. Waithman J., Moffat J.M., Patterson N.L., van Beek A.E., Mintern J.D. Reference Module in Biomedical Sciences. Elsevier; Amsterdam, The Netherlands: 2014. Antigen Presentation.

MeSH terms

Substances