. 2024 Dec 19;25(24):13607.
doi: 10.3390/ijms252413607.

Divergent Contribution of Cytoplasmic Actins to Nuclear Structure of Lung Cancer Cells

Affiliations

Divergent Contribution of Cytoplasmic Actins to Nuclear Structure of Lung Cancer Cells

Galina Shagieva et al. Int J Mol Sci. .

Abstract

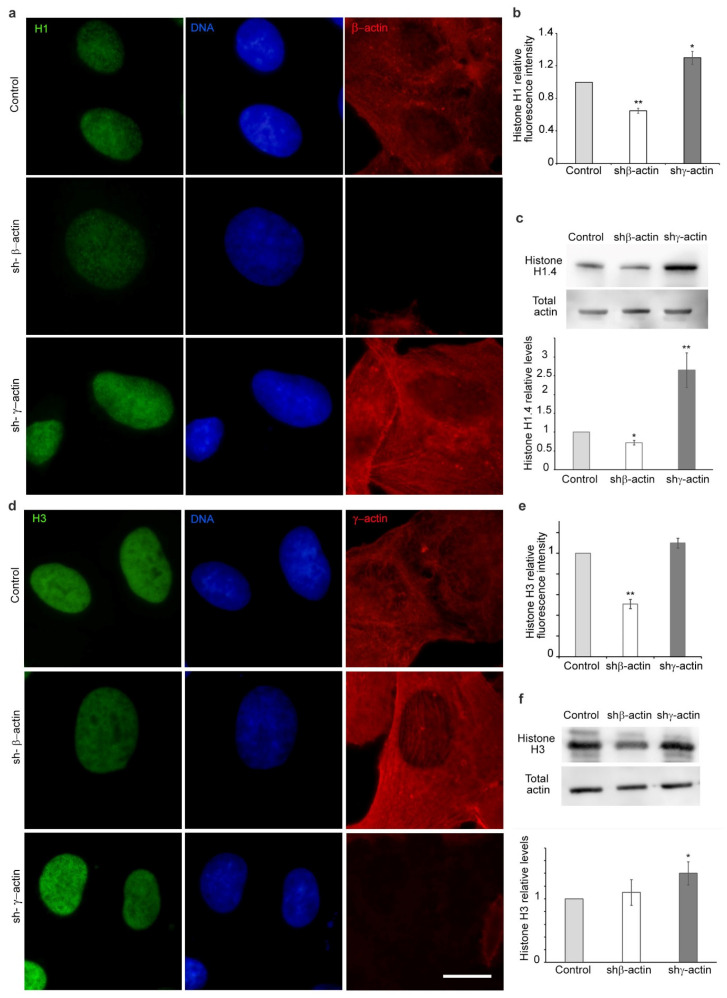
A growing body of evidence suggests that actin plays a role in nuclear architecture, genome organisation, and regulation. Our study of human lung adenocarcinoma cells demonstrates that the equilibrium between actin isoforms affects the composition of the nuclear lamina, which in turn influences nuclear stiffness and cellular behaviour. The downregulation of β-actin resulted in an increase in nuclear area, accompanied by a decrease in A-type lamins and an enhancement in lamin B2. In contrast, the suppression of γ-actin led to upregulation of the lamin A/B ratio through an increase in A-type lamins. Histone H3 post-translational modifications display distinct patterns in response to decreased actin isoform expression. The level of dimethylated H3K9me2 declined while acetylated H3K9ac increased in β-actin-depleted A549 cells. In contrast, the inhibition of γ-actin expression resulted in a reduction in H3K9ac. Based on our observations, we propose that β-actin plays a role in chromatin compaction and deactivation, and is involved in the elevation of nuclear stiffness through the control of the lamins ratio. The non-muscle γ-actin is presumably responsible for chromatin decondensation and activation. The identification of novel functions for actin isoforms offers insights into the mechanisms through which they influence cell fate during development and cancer progression.

Keywords: chromatin; histone; lamin; nucleus; β-actin; γ-actin.


Conflict of interest statement

The authors declare no conflicts of interest.

Figures

Figure 1
Figure 1
The effect of the non-muscle actin ratio on A549 cell morphology and nuclear area and chromatin texture. (a) Alteration of A549 phenotype in the presence of shRNA to β- or γ-actin (4 days). Immunofluorescence microscopy. β-Actin—red, γ-actin—green, DNA—blue. Scale bar—10 µm; (b) Western blotting analysis of A549 cells treated with shRNA to non-muscle actins (4 days); (c) Variation in nuclear area and intensity of DAPI staining in A549 cells upon suppression of β- or γ-actin (4 days). DNA—blue; the impact of β- or γ-actin downregulation on the relative nuclear area. Scale bar—10 µm; (d) and the average intensity of nuclear DAPI staining (e) in A549 cells (4 days); (f) The silencing of non-muscle actins had no significant effect on the integrated density of DAPI fluorescence. Mann–Whitney U test was used for the statistical analysis for all the depicted comparisons. Asterisks indicate p-values < 0.05 (*) or <0.01 (**) for all panels.
Figure 2
Figure 2
The isoform-specific effects of decreased non-muscle actin expression on lamina composition in A549 cell line. (a,b) The effects of shRNA treatment targeting non-muscle actins (4 days) on lamins A/C in A549 cells, immunofluorescence microscopy. Lamins A/C—green, γ-actin—red, DNA—blue; (c) Western blot analysis of lamins A/C in A549 cell line (shRNA to β- or γ-actin, 4 days); (d,e) Lamin B2 immunofluorescence depending on the suppression of β- or γ-actin in A549 cells (4 days). Lamin B2—green, γ -actin—red, DNA—blue; (f) Western blot analysis of lamin B2 in A549 cells (shRNA to β- or γ-actin, 4 days). Mann–Whitney U test was used for the statistical analysis for all the depicted comparisons. Asterisks indicate p-values <0.01 (**) for all panels. Scale bar 10 µm for all immunofluorescent microscopy panels.
Figure 3
Figure 3
Laser scanning microscopy of lamin B2 immunofluorescence in A549 cells after shRNA targeting non-muscle actins treatment. (a) A comparative analysis of a control culture with shRNA derivatives (4 days). Lamin B2—green, β-actin—red, DNA—blue. Scale bar—10 µm; (b) Lamin B2 immunofluorescence in A549 treated with shRNA to β-actin (4 days). Lamin B2—green, DNA—blue. Scale bar—10 µm; (c) The mean IF intensity of lamin B2 in the nuclear envelope zone of A549 cells. Mann–Whitney U test was used for the statistical analysis for the depicted comparisons. Asterisks indicate p-values < 0.01 (**).
Figure 4
Figure 4
Selective suppression of non-muscle actins in A549 cells influences the expression of histones H1 and H3. (a,b) Immunofluorescent microscopy analysis for histone H1 in A549 cells with shRNA against β- or γ-actin. H1—green, DNA—blue, β-actin—red; (c) Western blot analysis of histone H1 in A549 cell line (shRNA to β- or γ-actin, 4 days); (d,e) Histone H3 immunofluorescence depending on the suppression of β- or γ-actin in A549 cells (4 days). Immunofluorescent microscopy. H3—green, DNA—blue, γ-actin—red; (f) Western blot analysis of histone H3 in A549 cells (shRNA to β- or γ-actin, 4 days). Mann–Whitney U test was used for the statistical analysis for all the depicted comparisons. Asterisks indicate p-values < 0.05 (*) or <0.01 (**) for all panels. Scale bar 10 µm for all immunofluorescent microscopy panels.
Figure 5
Figure 5
Histones H2A and H2B in A549 cells with selective suppression of cytoplasmic actins. (a,b) Immunofluorescent microscopy for histone H2A in A549 cells with shRNA against β- or γ-actin. H2A—green, DNA—blue, γ-actin—red; (c) Western blot analysis of histone H2A in A549 cells (shRNA to β- or γ-actin, 4 days); (d,e) Histone H2B analysis in A549 cells (shRNA to β- or γ-actin, 4 days); immunofluorescent microscopy. H2B—green, DNA—blue, γ-actin—red; (f) Western blot analysis for histone H2B in A549 cells with shRNA targeting β- or γ-actin (4 days). Mann–Whitney U test was used for the statistical analysis for all the depicted comparisons. Asterisks indicate p-values < 0.05 (*) or <0.01 (**) for all panels. Scale bar 10 µm for all immunofluorescent microscopy panels.
Figure 6
Figure 6
Laser scanning microscopy of histones H1 and H2B immunofluorescence in A549 cells after shRNA targeting non-muscle actins treatment. (a) Histone H1 immunofluorescence staining, where H1—green, DNA—blue, β-actin—red; (b) Histone H2B immunofluorescence staining, where H2A—green, DNA—blue, γ-actin—red. Scale bar 10 µm.
Figure 7
Figure 7
The influence of the selective actin suppression on post-translational modifications of histone H3. (a,b) Acetylated histone H3K9ac immunofluorescence staining in A549 cells (4 days). Immunofluorescent microscopy. H3K9ac—green, DNA—blue, β-actin—red; (c) Western blot analysis of acetylated histone H3K9ac in A549 cells (shRNA to β- or γ-actin, 4 days); (d,e) Dimethylated histone H3K9me2 in A549 cells in the presence of shRNA to β- or γ-actin (4 days). Immunofluorescent microscopy. H3K9me2—green, DNA—blue, γ-actin—red; (f) Western blot analysis for dimethylated histone H3K9me2 in A549 cells with shRNA targeting β- or γ-actin (4 days). Mann–Whitney U test was used for the statistical analysis for all the depicted comparisons. Asterisks indicate p-values < 0.05 (*) or <0.01 (**) for all panels. Scale bar 10 µm for all immunofluorescent microscopy panels.
Figure 8
Figure 8
The influence of the selective actin suppression on post-translational modifications of histone H3. (a) Acetylated histone H3K9ac immunofluorescence staining in A549 cells (4 days). LSM. H3K9ac—green, DNA—blue, β-actin—red; (b) Immunofluorescent staining for dimethylated histone H3K9me2 in A549 cells in the presence of shRNA to β- or γ-actin (4 days). LSM. H3K9me2—green, DNA—blue, γ-actin—red. Scale bar—10 µm.

Similar articles

References

    1. Pollard T.D. Actin and Actin-Binding Proteins. Cold Spring Harb. Perspect. Biol. 2016;8:a018226. doi: 10.1101/cshperspect.a018226. - DOI - PMC - PubMed
    1. Dugina V., Zwaenepoel I., Gabbiani G., Clement S., Chaponnier C., Clément S., Chaponnier C. Beta and Gamma-Cytoplasmic Actins Display Distinct Distribution and Functional Diversity. J. Cell Sci. 2009;122:2980–2988. doi: 10.1242/jcs.041970. - DOI - PubMed
    1. Perrin B.J., Ervasti J.M. The Actin Gene Family: Function Follows Isoform. Cytoskeleton. 2010;67:630–634. doi: 10.1002/cm.20475. - DOI - PMC - PubMed
    1. Dugina V., Khromova N., Rybko V., Blizniukov O., Shagieva G., Chaponnier C., Kopnin B., Kopnin P. Tumor Promotion by γ and Suppression by β Non-Muscle Actin Isoforms. Oncotarget. 2015;6:14556–14571. doi: 10.18632/oncotarget.3989. - DOI - PMC - PubMed
    1. Dugina V., Shagieva G., Khromova N., Kopnin P. Divergent Impact of Actin Isoforms on Cell Cycle Regulation. Cell Cycle. 2018;17:2610–2621. doi: 10.1080/15384101.2018.1553337. - DOI - PMC - PubMed

LinkOut - more resources