. 2024 Dec 20;25(24):13661.
doi: 10.3390/ijms252413661.

Suppression of Pathological Allergen-Specific B Cells by Protein-Engineered Molecules in a Mouse Model of Chronic House Dust Mite Allergy

Affiliations

Suppression of Pathological Allergen-Specific B Cells by Protein-Engineered Molecules in a Mouse Model of Chronic House Dust Mite Allergy

Nikola Ralchev et al. Int J Mol Sci. .

Abstract

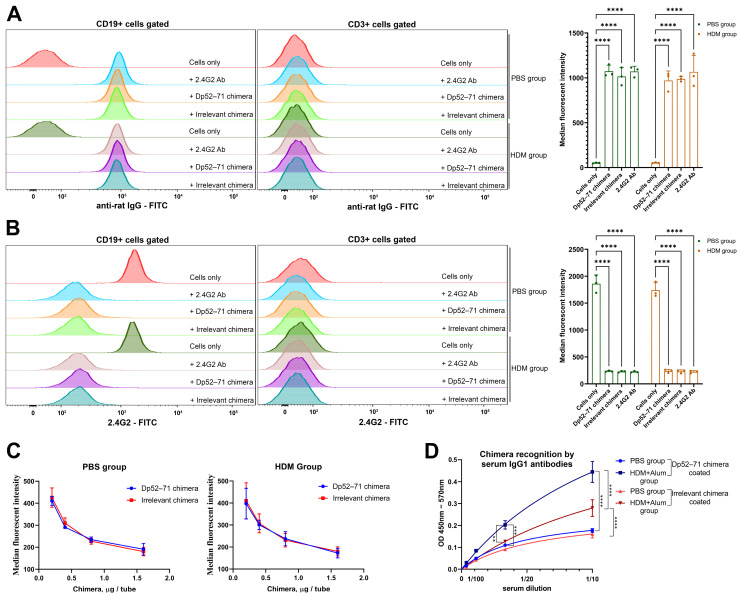
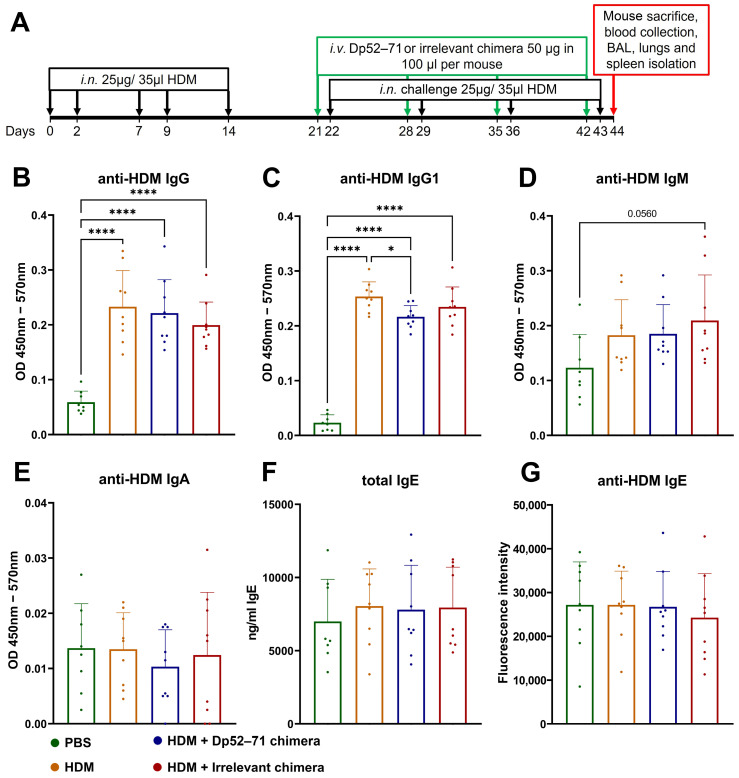
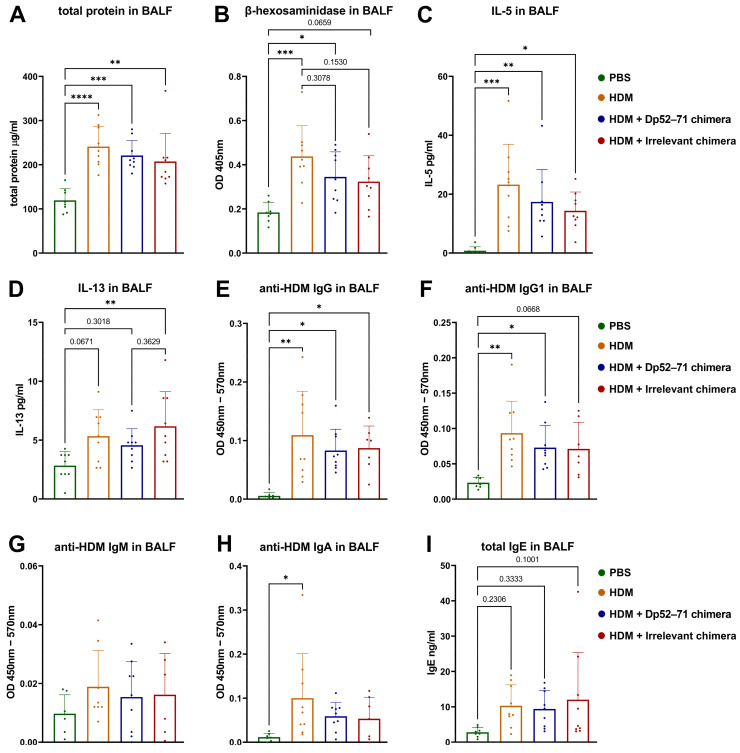
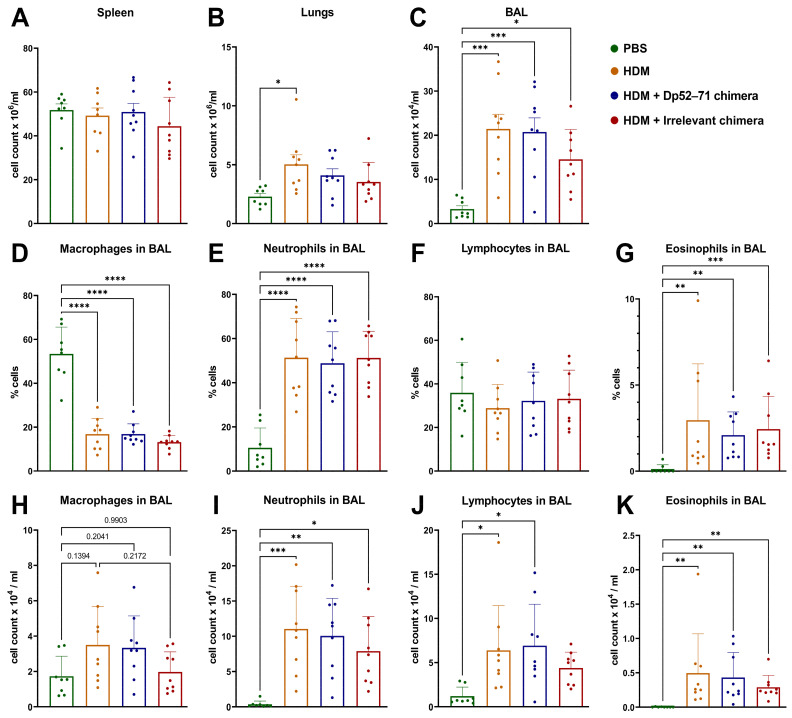
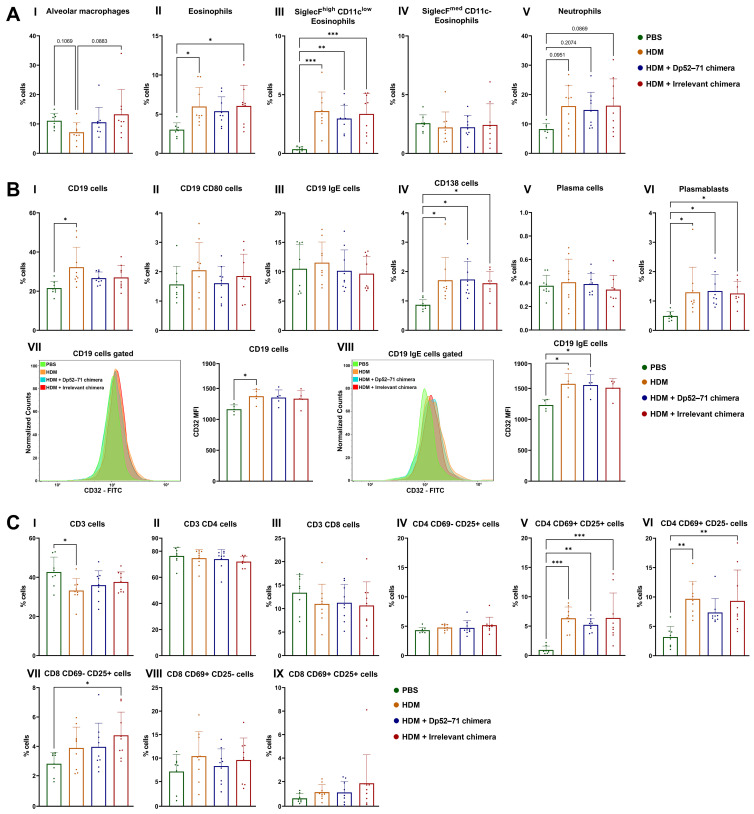
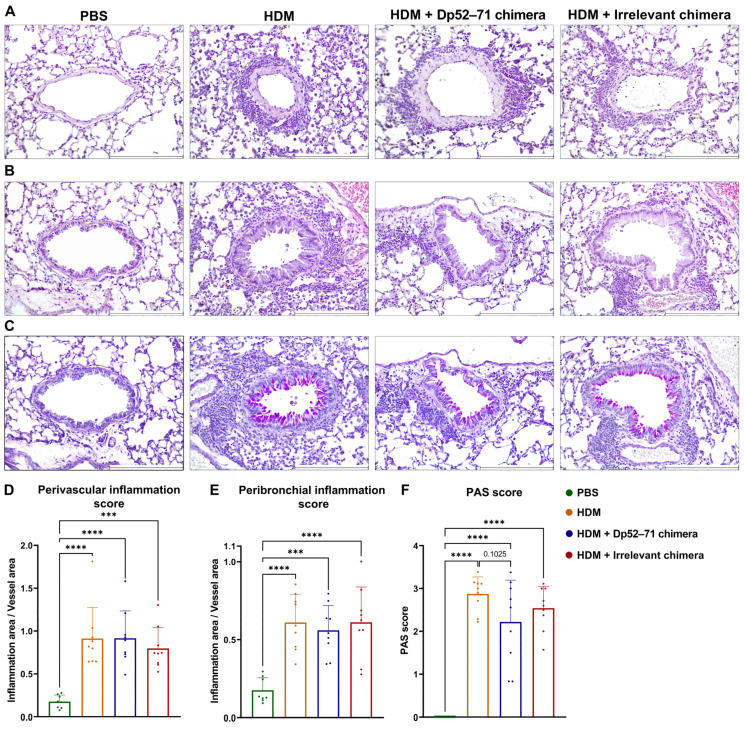
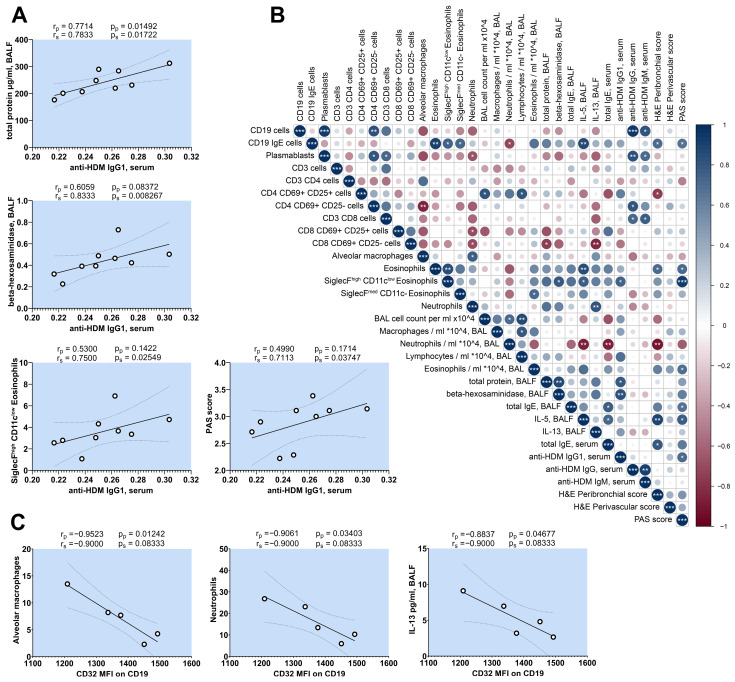
Der p1 is one of the major allergens causing house dust mite (HDM) allergy. Pathological Der p1-specific B cells play a key role in allergic inflammation as producers of allergen-specific antibodies. Crosslinking the inhibitory FcγRIIb with the B cell receptor triggers a high-affinity suppressive signal in B cells. Selective elimination of allergen-specific cells could potentially be achieved by administering chimeric molecules that combine, through protein engineering, the FcγRIIb-targeting monoclonal 2.4G2 antibody with the epitope-carrying Dp52-71 peptides from Der p1. We tested this hypothesis, in a chronic mouse model of HDM allergy induced in BalB/c mice, using FACS and ELISA assays, along with histopathological and correlational analyses. Dp52-71chimera treatment of HDM-challenged mice led to a decrease in serum anti-HDM IgG1 antibodies, a reduction in BALF β-hexosaminidase levels, a lowered number of SiglecFhigh CD11clow eosinophils, and an improved lung PAS score. Furthermore, we observed overexpression of FcγRIIb on the surface of CD19 cells in the lungs of HDM-challenged animals, which negatively correlated with the levels of lung alveolar macrophages, neutrophils, and BALF IL-13. Taken together, these results suggest that the use of FcγRIIb overexpression, combined with the expansion of chimeric protein technology to include more epitopes, could improve the outcome of inflammation.

Keywords: FcγRIIb receptors; chimeric molecules; chronic house dust mite allergy model.


Conflict of interest statement

The authors declare no conflicts of interest.

Figures

Figure 1
Figure 1
The Dp52–71chimera binds to the FcγRIIb receptor on murine B cells and is recognized by epitope-specific serum IgG1 antibodies. (A) Dp52–71 chimera and irrelevant chimera binding on the surface of CD19 and CD3 cells was proved by FACS analysis. Splenocytes from healthy and HDM-challenged mice were incubated with both chimeras and secondary incubated with FITC-conjugated anti-rat IgG (left part). Summarized graph for the median fluorescent intensity (MFI) of anti-rat–FITC antibody fluorescence (right part). (B) Dp52–71 chimera competes with commercial 2.4G2-FITC antibody for the same receptor. The same splenocytes were pre-incubated with Dp52–71 chimera, irrelevant chimera, and pure 2.4G2 antibody, and secondary incubated with 2.4G2-FITC antibody (left part). Gated CD19 and CD3 cells were analyzed by FACS (left part). Summarized data of the 2.4G2-FITC binding to the FcγRIIb receptor on B cells (right part). (C). Dose-dependent inhibition of the 2.4G2-FITC binding to the FcγRIIb receptor. (D). Peptide recognition on the Dp52–71 chimera by serum IgG1 antibodies from HDM + Alum-sensitized mice analyzed by ELISA. Data are represented as mean ± SD of at least 3 mice per group. The differences between the groups were evaluated using a two-way ANOVA following Tukey’s multiple comparisons test; ** p < 0.01; *** p < 0.001; **** p < 0.0001. Data are representative of at least 5 independent experiments.
Figure 2
Figure 2
Scheme of the chronic HDM allergy model and treatment schedule (A). Serum levels of anti-HDM IgG (B), IgG1 (C), IgM (D), IgA (E), IgE (G), and total IgE antibodies (F) in healthy mice and HDM-challenged mice treated with PBS, Dp52–71 chimera, or irrelevant chimera, measured by ELISA. Data are shown as mean ± SD of 8–9 mice per group. p values are calculated using a one-way ANOVA following Tukey’s multiple comparisons test; * p < 0.05; **** p < 0.0001. Data are representative of at least 3 independent experiments.
Figure 3
Figure 3
Protein analysis of BAL fluid performed by ELISA. BALF levels of total protein (A), β-hexosaminidase activity (B), IL-5 (C), IL-13 (D), HDM-specific IgG (E), IgG1 (F), IgM (G), IgA (H), and total IgE (I) were investigated in all groups. Data are shown as mean ± SD of 6–9 mice per group. The differences between the groups were evaluated using a one-way ANOVA, following Tukey’s multiple comparisons test; p values are indicated on the graphs: * p < 0.05; ** p < 0.01; *** p < 0.001; **** p < 0.0001. Data are representative of at least 3 independent experiments.
Figure 4
Figure 4
Total cells (per milliliter) isolated from spleen (A), lungs (B), and BAL (C). Differential staining of cells in BAL, defining macrophages (D,H), neutrophils (E,I), lymphocytes (F,J), and eosinophils (G,K), and expressed as percentages and cell count per ml of recovered BAL liquid. Data are shown as mean ± SD of 8–9 mice per group. The differences between the groups were evaluated using a one-way ANOVA followed by Tukey’s multiple comparisons test, or a Kruskal–Wallis test followed by Dunn’s multiple comparisons test, depending on the normality of the data; p values are indicated on the graphs: * p < 0.05; ** p < 0.01; *** p < 0.001; **** p < 0.0001.
Figure 5
Figure 5
Phenotyping of immune cells in the lungs by FACS analyses. (A) Characterization of myeloid cell types—alveolar macrophages (I), SiglecFhigh CD11clow (III), SiglecFmed CD11c− (IV) and total eosinophils (II), and neutrophils (V)—presented as the percentage of the parent population. (B) Analysis of B and antibody-secreting cells—percentages of CD19 cells (I), CD19 CD80 cells (II), CD19 IgE cells (III), CD138 cells (IV), plasma cells (V), plasmablasts (VI), and CD32 mean fluorescent intensity (MFI) of CD19 (VII) and CD19 IgE cells (VIII). (C) Phenotyping of T cells—CD3 cells (I), CD3 CD4 cells (II), CD3 CD8 cells (III), CD4 CD69 − CD25 + cells (IV), CD4 CD69 + CD25 + cells (V), CD4 CD69 + CD25 − cells (VI), CD8 CD69 − CD25 + cells (VII), CD8 CD69 + CD25 − cells (VIII), and CD4 CD69 + CD25 + cells (IX). Data are shown as mean ± SD of 8–9 mice per group. The differences between the groups were evaluated using a one-way ANOVA followed by Tukey’s multiple comparisons, or a Kruskal–Wallis test followed by Dunn’s multiple comparisons test, depending on the normality of the data; p values are indicated on the graphs: * p < 0.05; ** p < 0.01; *** p < 0.001. Data are representative of at least 4 independent experiments.
Figure 6
Figure 6
Histological analysis of lung pathology. Representative images and histological score of perivascular (A,D) and peribronchial (B,E) inflammation of H&E-stained lung tissue. Periodic acid-Schiff (PAS) score (F) and representative images for mucus production (C). Scale bars, 250 µm. Data are shown as mean ± SD of 8–9 mice per group. p values were calculated using a one-way ANOVA followed by Tukey’s multiple comparisons test; p values are indicated on the graphs: *** p < 0.001; **** p < 0.0001. Data are representative of at least 4 independent experiments.
Figure 7
Figure 7
Correlation analysis of HDM allergy group. Correlation analysis of serum levels of anti-HDM IgG1 (A) and CD32 expression of B cells in the lungs (C) versus other parameters. Pearson (rp) and Spearman (rs) correlation coefficients and p values for Spearman (ps) and Pearson (pp) correlation analysis are indicated above each figure. (B) Correlation matrix of key immunological parameters achieved through Spearman’s test (* p < 0.05; ** p < 0.01; *** p < 0.001).

Similar articles

References

    1. Huang H.-J., Sarzsinszky E., Vrtala S. House dust mite allergy: The importance of house dust mite allergens for diagnosis and immunotherapy. Mol. Immunol. 2023;158:54–67. doi: 10.1016/j.molimm.2023.04.008. - DOI - PubMed
    1. Calderón M.A., Linneberg A., Kleine-Tebbe J., De Blay F., de Rojas D.H.F., Virchow J.C., Demoly P. Respiratory allergy caused by house dust mites: What do we really know? J. Allergy Clin. Immunol. 2014;136:38–48. doi: 10.1016/j.jaci.2014.10.012. - DOI - PubMed
    1. Sánchez-Borges M., Fernandez-Caldas E., Thomas W.R., Chapman M.D., Lee B.W., Caraballo L., Acevedo N., Chew F.T., Ansotegui I.J., Behrooz L., et al. International consensus (ICON) on: Clinical consequences of mite hypersensitivity, a global problem. World Allergy Organ. J. 2017;10:14. doi: 10.1186/s40413-017-0145-4. - DOI - PMC - PubMed
    1. Calderón M.A., Kleine-Tebbe J., Linneberg A., De Blay F., de Rojas D.H.F., Virchow J.C., Demoly P. House Dust Mite Respiratory Allergy: An Overview of Current Therapeutic Strategies. J. Allergy Clin. Immunol. Pract. 2015;3:843–855. doi: 10.1016/j.jaip.2015.06.019. - DOI - PubMed
    1. Malone M. Review: Side Effects of Some Commonly Used Allergy Medications (Decongestants, Anti-Leukotriene Agents, Antihistamines, Steroids, and Zinc) and Their Safety in Pregnancy. Int. J. Allergy Medicat. 2017;3:24. doi: 10.23937/2572-3308.1510024. - DOI

LinkOut - more resources