. 2024 Dec 20;25(24):13665.
doi: 10.3390/ijms252413665.

Identification of Protein Networks and Biological Pathways Driving the Progression of Atherosclerosis in Human Carotid Arteries Through Mass Spectrometry-Based Proteomics

Affiliations

Identification of Protein Networks and Biological Pathways Driving the Progression of Atherosclerosis in Human Carotid Arteries Through Mass Spectrometry-Based Proteomics

Gergő Kalló et al. Int J Mol Sci. .

Abstract

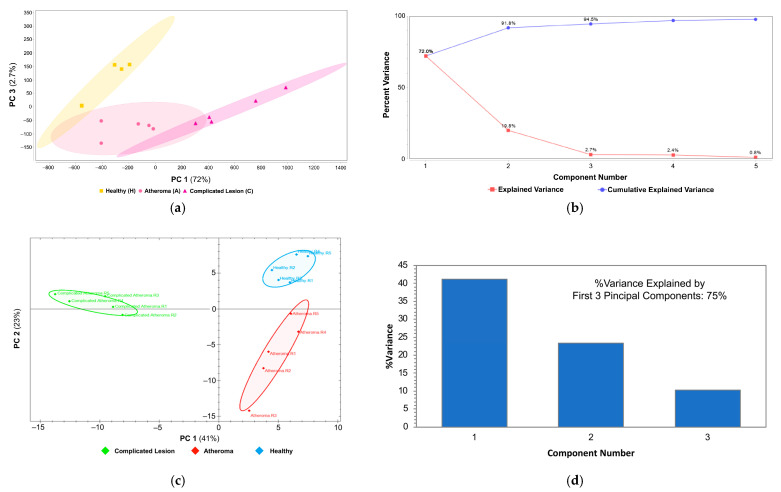
Vulnerable atherosclerotic plaques, especially hemorrhaged lesions, are the major cause of mortalities related to vascular pathologies. The early identification of vulnerable plaques helps to stratify patients at risk of developing acute vascular events. In this study, proteomics analyses of human carotid artery samples collected from patients with atheromatous plaques and complicated lesions, respectively, as well as from healthy controls were performed. The proteins isolated from the carotid artery samples were analyzed by a bottom-up shotgun approach that relied on nanoflow liquid chromatography-tandem mass spectrometry analyses (LC-MS/MS) using both data-dependent (DDA) and data-independent (DIA) acquisitions. The data obtained by high-resolution DIA analyses displayed a stronger distinction among groups compared to DDA analyses. Differentially expressed proteins were further examined using Ingenuity Pathway Analysis® with focus on pathological and molecular processes driving atherosclerosis. From the more than 150 significantly regulated canonical pathways, atherosclerosis signaling and neutrophil extracellular trap signaling were verified by protein-targeted data extraction. The results of our study are expected to facilitate a better understanding of the disease progression's molecular drivers and provide inspiration for further multiomics and hypothesis-driven studies.

Keywords: atherosclerosis; bioinformatics; canonical pathways; complicated lesion; data-dependent LC–MS/MS; data-independent LC–MS/MS; human carotid artery; protein–protein interaction networks; quantitative label-free proteomics.


Conflict of interest statement

The authors declare no conflicts of interest.

Figures

Figure 1
Figure 1
Similarities among the classified human carotid endarterectomies with DDA and DIA methods of label-free proteomics. (a) PCA plot constructed by Scaffold Quant for DDA-based analysis showing similarities among the healthy (H, yellow box), atheroma (A, pink circle), and complicated lesion (C, purple triangle) groups; (b) scree plot explaining the variance by each principal component (PC) from Scaffold Quant results; (c) PCA plot constructed by Spectronaut showing similarities among the healthy (H, blue), atheroma (A, red), and complicated lesion (C, green) groups from DIA-based analysis; (d) components bar plot: how the first three PCs explain the variance from the Spectronaut results.
Figure 2
Figure 2
IPA® mapping of proteins regulated in different forms of atherosclerotic lesions obtained from human carotid arteries. (a) The protein–protein interaction network of proteins related to atherogenesis, atherosclerosis, atherosclerotic lesions, cerebrovascular dysfunction, and peripheral vascular disease. Molecule activation predictor (MAP) showing the overall effect of complicated atherosclerotic lesions: blue dashed line—inhibition/decrease; orange dashed line—activation/increase; yellow dashed line—cannot be predicted; orange solid line—activation; blue solid line—inhibition. Insets: 1st bar A versus C, DDA; 2nd bar—C versus H, DDA; 3rd bar—A versus H, DIA; 4th bar—C versus H, DIA. (b) An IPA® protein interaction network linked to cardiac dysfunction, lipid metabolism, and small-molecule biochemistry. Insets: 1st bar A versus C, DDA; 2nd bar—C versus H, DDA; 3rd bar—A versus H, DIA; 4th bar—C versus H, DIA. Map shows the overall effect of complicated atherosclerotic lesions (C samples). CP—canonical pathway; red—upregulation; green—downregulation; shade of color is indicative of the extent of change in expression; solid line—direct relationship; dashed line—indirect relationship; yellow dashed or solid line—activity cannot be predicted. Abbreviation of proteins are listed in Table S8. Asterisks indicate multiple protein isoforms from the same gene. (c) Canonical pathway comparison analysis: 1st panel—A versus H, DDA; 2nd panel—C versus A, DDA; 3rd panel—A versus H, DIA; 4th panel—C versus A, DIA. Blue box and orange box designate inhibition/decrease and activation/increase of the pathway, respectively, with z-score indicated by shade of color (scale on the top, with white stipulating no activation). Grey box indicates that IPA® could not make a prediction.
Figure 3
Figure 3
IPA®’s atherosclerosis signaling canonical pathway complemented with previous findings by our group regarding the role of red blood cell lysis followed by hemoglobin release, hemoglobin oxidation, and heme release [20,21,22]. Symbols with purple borders indicate proteins in the pathway that showed statistically significant differences in expression among the study groups (Table S2). Asterisks indicate that multiple protein identifiers (isoforms) in the input file were mapped to the same gene. The meaning of colors for shapes and lines is shown in the inset. Complemented steps are marked with red arrows.
Figure 4
Figure 4
Quantitative survey by the Scaffold DIA processing methods measuring the differential expression of key proteins in IPA®’s atherosclerosis signaling canonical pathway. Box plots generated by the software: H (yellow boxes), A (pink boxes), and C samples (purple boxes). ANOVA followed by post hoc Tukey–Kramer tests (n = 5, p < 0.05): statistically significant difference between A and H for apolipoprotein A1, collagen type XVIII alpha, and clusterin; statistically significant difference between C and H for apolipoprotein A1, collagen type XVIII alpha, clusterin, S100A8, apolipoprotein B, and integrin beta-3; statistically significant difference between C and A for apolipoprotein A1, collagen type XVIII alpha, clusterin, S100A8, and integrin beta-3.
Figure 5
Figure 5
A Scaffold DIA-based quantitative survey of proteins identified as surrogate endpoints involved in the neutrophil extracellular trap (NET) signaling canonical pathway shown fully in Figure S2. (a) View focused on myeloperoxidase (MPO) and lactotransferrin (LTF) with the Path Tracer of IPA®; (b) box plots generated by Scaffold DIA for LTF and MPO from H (yellow boxes), A (pink boxes), and C samples (purple boxes); ANOVA followed by post hoc Tukey–Kramer tests (n = 5, p < 0.05): statistically significant difference between C and H, as well as C and A, for both LTF and MPO; (c) view focused on platelet factor 4 (PF4) and collagen with the Path Tracer of IPA® and (d) box plots generated by Scaffold DIA for collagen type 3 alpha and PF4 from H (yellow boxes), A (pink boxes), and C samples (purple boxes); ANOVA followed by post hoc Tukey–Kramer tests (n = 5, p < 0.05): statistically significant difference between C and H for both collagen type 3 alpha and PF4; statistically significant difference between C and A for PF4. In figures (a,c), blue indicates a decrease and inhibition, while red and orange denote an increase and activation, respectively.

Similar articles

References

    1. Stefanadis C., Antoniou C.-K., Tsiachris D., Pietri P. Coronary atherosclerotic vulnerable plaque: Current perspectives. J. Am. Heart Assoc. 2017;6:e005543. doi: 10.1161/JAHA.117.005543. - DOI - PMC - PubMed
    1. Hafiane A. Vulnerable plaque, characteristics, detection, and potential therapies. J. Cardiovasc. Dev. Dis. 2019;6:26. doi: 10.3390/jcdd6030026. - DOI - PMC - PubMed
    1. Gaba P., Gersh B.J., Muller J., Narula J., Stone G.W. Evolving concepts of the vulnerable atherosclerotic plaque and the vulnerable patient: Implications for patient care and future research. Nat. Rev. Cardiol. 2023;20:181–196. doi: 10.1038/s41569-022-00769-8. - DOI - PubMed
    1. Kurihara O., Takano M., Miyauchi Y., Mizuno K., Shimizu W. Vulnerable atherosclerotic plaque features: Findings from coronary imaging. J. Geriatr. Cardiol. 2021;18:577–584. doi: 10.11909/j.issn.1671-5411.2021.07.005. - DOI - PMC - PubMed
    1. Chiorescu R.M., Mocan M., Inceu A.I., Buda A.P., Blendea D., Vlaicu S.I. Vulnerable atherosclerotic plaque: Is there a molecular signature? Int. J. Mol. Sci. 2022;23:13638. doi: 10.3390/ijms232113638. - DOI - PMC - PubMed

MeSH terms

LinkOut - more resources