. 2024 Dec 21;25(24):13690.
doi: 10.3390/ijms252413690.

Inhibiting the Cholesterol Storage Enzyme ACAT1/SOAT1 in Aging Apolipoprotein E4 Mice Alters Their Brains' Inflammatory Profiles

Affiliations

Inhibiting the Cholesterol Storage Enzyme ACAT1/SOAT1 in Aging Apolipoprotein E4 Mice Alters Their Brains' Inflammatory Profiles

Thao N Huynh et al. Int J Mol Sci. .

Abstract

Aging and apolipoprotein E4 (APOE4) are the two most significant risk factors for late-onset Alzheimer's disease (LOAD). Compared to APOE3, APOE4 disrupts cholesterol homeostasis, increases cholesteryl esters (CEs), and exacerbates neuroinflammation in brain cells, including microglia. Targeting CEs and neuroinflammation could be a novel strategy to ameliorate APOE4-dependent phenotypes. Toll-like receptor 4 (TLR4) is a key macromolecule in inflammation, and its regulation is associated with the cholesterol content of lipid rafts in cell membranes. We previously demonstrated that in normal microglia expressing APOE3, inhibiting the cholesterol storage enzyme acyl-CoA:cholesterol acyltransferase 1 (ACAT1/SOAT1) reduces CEs, dampened neuroinflammation via modulating the fate of TLR4. We also showed that treating myelin debris-loaded normal microglia with ACAT inhibitor F12511 reduced cellular CEs and activated ABC transporter 1 (ABCA1) for cholesterol efflux. This study found that treating primary microglia expressing APOE4 with F12511 also reduces CEs, activates ABCA1, and dampens LPS-dependent NFκB activation. In vivo, two-week injections of nanoparticle F12511, which consists of DSPE-PEG2000, phosphatidylcholine, and F12511, to aged female APOE4 mice reduced TLR4 protein content and decreased proinflammatory cytokines, including IL-1β in mice brains. Overall, our work suggests nanoparticle F12511 is a novel agent to ameliorate LOAD.

Keywords: ACAT inhibitor; ATP binding cassette subfamily A member 1; Alzheimer’s disease; DSPE-PEG2000; F12511; LOAD; NFκB; TLR4; acyl-CoA:cholesterol acyltransferase; apolipoprotein E4 (APOE4); cholesterol; cholesteryl esters; interleukin-1 beta; late-onset Alzheimer’s disease; lipid rafts; microglia; phosphatidylcholine; sterol O-acyltransferase 1.


Conflict of interest statement

The authors declare no conflicts of interest.

Figures
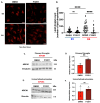
Figure 1
Figure 1
In vitro F12511 treatment reduces lipid droplets and upregulates ABCA1 protein content in primary APOE4 microglia but not in immortalized APOE4 astrocytes. (A) Nile Red assay in primary APOE3 and APOE4 microglia treated with or without F12511. Scale bar: 15 μm. (B) Lipid droplet quantification from Nile Red data. N = 40 cells per treatment group were analyzed. The procedure for Nile red assay and imaging analysis were described in Section 4. (C) Representative Western blot monitoring ABCA1 protein content in APOE4 primary microglia treated with or without F12511. (D) Quantification of Western blot data. The procedures for Western blot analysis and quantitation are described in Section 4. (E) Representative Western blot monitoring ABCA1 protein content in APOE4 immortalized astrocytes treated with or without F12511. (F) Quantification of Western blot data. N = 3 for Western blot experiments. The value of cells treated with DMSO was normalized to 1. Data are expressed as mean ± SEM. ** p < 0.01; **** p < 0.0001; ns: not significant.
Figure 2
Figure 2
Pharmaceutical inhibition of ACAT1 by F12511 dampens NFκB activation in LPS-induced primary E4 microglia in a TLR4-dependent (TAK-242 sensitive) manner. (A) Representative Western blot of keys NFκB activation markers P(S536)-p65, p65, P(S32)-IκB-α, IκB-α. Western blot quantification for (B) P(S536)-p65/p65 ratio and (C) P(S32)-IκB-α/IκB-α ratio. N = 3. The value of cells treated with DMSO with no LPS was normalized to 1. Data are expressed as mean ± SEM. * p < 0.05, *** p < 0.001, **** p < 0.0001.
Figure 3
Figure 3
Design of F12511 in vivo efficacy studies in APOE3 and APOE4 KI mice at two different age ranges. (A) Diagram and components of nanoparticle with or without ACAT1 inhibitor F12511. Nanoparticles comprise DSPE-PEG2000 and PC, according to the procedure published in [49]. (B) Animal treatment scheme. Mice were aged 9 months old (9 M) or 16–20 months old (16–20 M) for this study, followed by daily injection by alternate intravenous (IV) and retro-orbital (RO) routes. Mice were then perfused with PBS, and forebrain tissues were collected and homogenized for Western blot and Luminex analysis. See Section 4 for details. Created with BioRender.
Figure 4
Figure 4
Two weeks of daily alternate IV and RO injections of NPF at 46 mg/kg subtly change the inflammatory profile in 9 M-old APOE4 mice but not in APOE3 mice. (A) Representative Western blot and quantitative analysis of relative TLR4 expression in 9 M-old mice forebrain homogenate. Quantitative analysis revealed that NPF slightly reduced total TLR4 protein expression in APOE4 forebrain homogenate but not in APOE3 mice. (B) Detectable Alzheimer’s-related cytokines and cytokines significantly altered by drug treatment from MILLIPLEX xMAP analysis were plotted individually. IL-13 and IL-9 changed significantly in APOE4-treated forebrain homogenates, while APOE3 mice were unaffected. The value of APOE3 mice treated with PBS injection was normalized to 1. Data are expressed as mean ± SEM. * p < 0.05,** p < 0.01, *** p < 0.001, **** p < 0.0001.
Figure 5
Figure 5
Two weeks of daily alternate IV and RO injection of nanoparticle F12511 at 46 mg/kg significantly alter the inflammatory profile and lipid droplet markers in both APOE3 and APOE4 forebrain at 16–20 M-old. (A) Representative Western blot and quantitative analysis of PLIN2 protein expression. (B) Representative Western blot and quantitative analysis of ABCA1 protein expression (C) Representative Western blot and quantitative analysis of relative TLR4 protein expression in 16–20 M-old, injected forebrain homogenate. (D) Heatmap visualizing average cytokines readings from each treatment group with Z-score transformation (left panel). Detectable Alzheimer’s-related cytokines and cytokines are significantly altered by drug treatment from MILLIPLEX xMAP analysis (highlighted by yellow stars) were plotted individually (right panels). The value of APOE3 mice treated with PBS was normalized to 1. Data are expressed as mean ± SEM. * p < 0.05, ** p < 0.01, *** p < 0.001, **** p < 0.0001.
Figure 5
Figure 5
Two weeks of daily alternate IV and RO injection of nanoparticle F12511 at 46 mg/kg significantly alter the inflammatory profile and lipid droplet markers in both APOE3 and APOE4 forebrain at 16–20 M-old. (A) Representative Western blot and quantitative analysis of PLIN2 protein expression. (B) Representative Western blot and quantitative analysis of ABCA1 protein expression (C) Representative Western blot and quantitative analysis of relative TLR4 protein expression in 16–20 M-old, injected forebrain homogenate. (D) Heatmap visualizing average cytokines readings from each treatment group with Z-score transformation (left panel). Detectable Alzheimer’s-related cytokines and cytokines are significantly altered by drug treatment from MILLIPLEX xMAP analysis (highlighted by yellow stars) were plotted individually (right panels). The value of APOE3 mice treated with PBS was normalized to 1. Data are expressed as mean ± SEM. * p < 0.05, ** p < 0.01, *** p < 0.001, **** p < 0.0001.
Figure 6
Figure 6
A working model to account for the effects of ACAT1 blockade in APOE4 aging microglia. In aging and APOE4, myelin debris and disease-associated molecular patterns (DAMPs), including dead cell debris, are phagocytosed by resident microglia. APOE4-associated phenotypes are highlighted using red or blue arrows with red captions (increased activity) and blue captions (decreased activity). Cholesterol derived from myelin debris, APOE4 protein particles, or dead cells’ cholesterol-rich membranes enters microglial cells, increasing the cholesterol supply to ACAT1 at the ER. This activates ACAT1 through sterol-dependent allosteric control [62,63], leading to the conversion of cholesterol into CE (red arrow). When ACAT1 is inhibited (e.g., by using K604 or F12511), CE content decreases. Cholesterol diverted from the ACAT1 substrate pool can be converted into oxysterols, downregulating cholesterol biosynthesis by suppressing HMG-CoA reductase [27]. Additionally, this diversion upregulates ABCA1 gene expression for cholesterol efflux via an LXR-dependent pathway [32] (solid black arrows). Blocking ACAT1 also redirects cholesterol from the ACAT1 subdomain in the ER to the plasma membrane, promoting cholesterol efflux via ABCA1 and to other subcellular organelles, such as the Golgi and mitochondria. These cholesterol transfer steps likely occur through multiple membrane contact sites (MCS) between these organelles and the ACAT1 subdomain(s) in the ER [56,64,65]. APOE4 protein disrupts endo/lysosome function [8,10,11,41,60,66]. As endo/lysosomes malfunction, the process of membrane cholesterol recycling from endo/lysosomes back to the plasma membrane is impaired (blue arrow, blue caption). This results in defective intracellular cholesterol trafficking in a cell-type-dependent manner [7,8,9], leading to cholesterol accumulation in the lysosomes and increased proinflammatory responses. The accumulation of cholesterol in endo/lysosomes may also lead to an increase in ER cholesterol. Cholesterol transfer may occur through membrane contact sites (MCS) between endo/lysosomes and the ER (red arrow, red caption). Cholesterol in the ER then moves to the subdomain where ACAT1 resides, where it is esterified by ACAT1, resulting in the accumulation of CE-rich lipid droplets. ACAT1 blockade activates cholesterol transfer steps (shown as --------->) (dashed black arrows), which are not affected by APOE4 protein defects. ACAT1 inhibition may also influence cholesterol content and function by increasing endocytosis of membranes rich in TLR4 to the lysosome, promoting TLR4 degradation in the lipid raft microdomain that is enriched in TLR4 (Reviewed in [46]). Inhibiting ACAT1 activity leads to TLR4 degradation in lysosomes and dampens the proinflammatory response in these cells (dashed black arrows) [28]. The role of PC in the F12511 nanoparticle (Figure 8 in [30] and Figure 5A–D), may act within the lipid raft domain and work in concert with the ACAT1 inhibitor F12511. Created with BioRender.

Update of

References

    1. Reitz C., Rogaeva E., Beecham G.W. Late-onset vs nonmendelian early-onset Alzheimer disease: A distinction without a difference? Neurol. Genet. 2020;6:e512. doi: 10.1212/NXG.0000000000000512. - DOI - PMC - PubMed
    1. Isik A.T. Late onset Alzheimer’s disease in older people. Clin. Interv. Aging. 2010;5:307–311. doi: 10.2147/CIA.S11718. - DOI - PMC - PubMed
    1. 2024 Alzheimer’s disease facts and figures. Alzheimer’s Dement. 2024;20:3708–3821. doi: 10.1002/alz.13809. - DOI - PMC - PubMed
    1. Fortea J., Pegueroles J., Alcolea D., Belbin O., Dols-Icardo O., Vaqué-Alcázar L., Videla L., Gispert J.D., Suárez-Calvet M., Johnson S.C., et al. APOE4 homozygozity represents a distinct genetic form of Alzheimer’s disease. Nat. Med. 2024;30:1284–1291. doi: 10.1038/s41591-024-02931-w. - DOI - PubMed
    1. Liu C.C., Liu C.C., Kanekiyo T., Xu H., Bu G. Apolipoprotein E and Alzheimer disease: Risk, mechanisms and therapy. Nat. Rev. Neurol. 2013;9:106–118. doi: 10.1038/nrneurol.2012.263. - DOI - PMC - PubMed

MeSH terms

LinkOut - more resources