. 2024 Dec 22;25(24):13707.
doi: 10.3390/ijms252413707.

Phytochemical Profile and In Vitro Cytotoxic, Genotoxic, and Antigenotoxic Evaluation of Cistus monspeliensis L. Leaf Extract

Affiliations

Phytochemical Profile and In Vitro Cytotoxic, Genotoxic, and Antigenotoxic Evaluation of Cistus monspeliensis L. Leaf Extract

Ghanya Al-Naqeb et al. Int J Mol Sci. .

Abstract

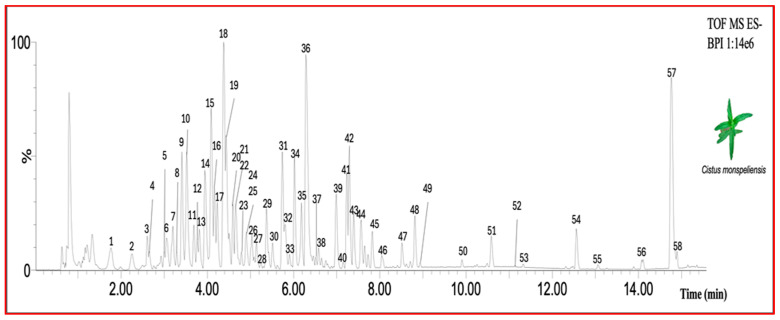
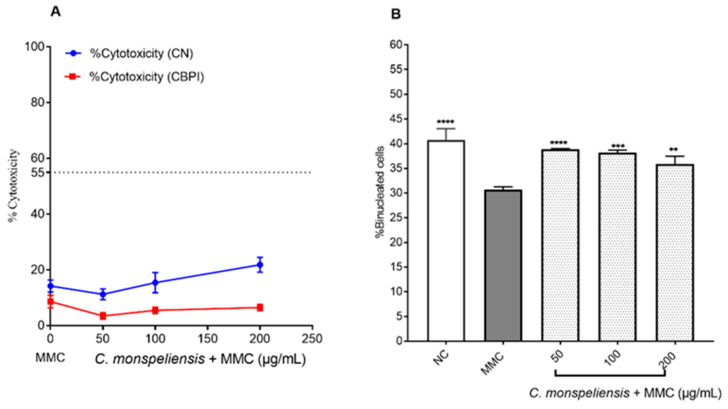
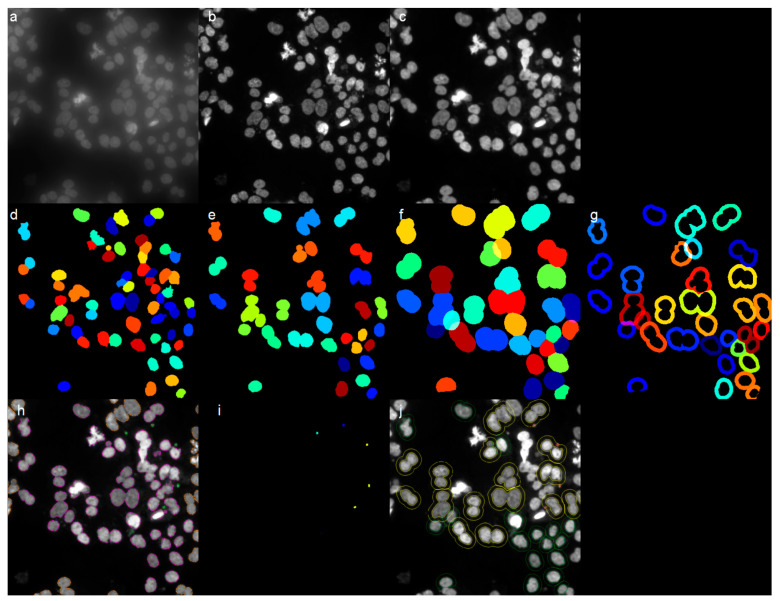
Cistus monspeliensis L. (C. monspeliensis) is used in Italian folk medicine. This study was performed to determine genotoxic and antigenotoxic effects of C. monspeliensis leaf extract against mitomycin C (MMC) using an in vitro cytokinesis-block micronucleus assay (CBMN) in the Chinese Hamster Ovarian K1 (CHO-K1) cell line. The phytochemical composition of C. monspeliensis extract was evaluated using an untargeted metabolomic approach by employing UPLC-PDA-ESI/MS. The automated in vitro CBMN assay was carried out using image analysis systems with a widefield fluorescence microscope and the ImageStreamX imaging flow cytometer. The phytochemical profile of C. monspeliensis extract showed, as the most abundant metabolites, punicalagin, myricetin, gallocathechin, and a labdane-type diterpene. C. monspeliensis, at the tested concentrations of 50, 100, and 200 μg/mL, did not induce significant micronuclei frequency, thus indicating the absence of a genotoxic potential. When testing the C. monspeliensis extract for antigenotoxicity in the presence of MMC, we observed a hormetic concentration-dependent effect, where low concentrations resulted in a significant protective effect against MMC-induced micronuclei frequency, and higher concentrations resulted in no effect. In conclusion, our findings demonstrate that C. monspeliensis extract is not genotoxic and, at low concentration, exhibits an antigenotoxic effect. In relation to this final point, C. monspeliensis may act as a potential chemo-preventive against genotoxic agents.

Keywords: Cistus monspeliensis; ImageStreamX imaging flow cytometer; antigenotoxicity; genotoxicity; phytochemicals.


Conflict of interest statement

The authors declare no conflicts of interest.

Figures

Figure 1
Figure 1
Base peak chromatogram (BPC) of diluted (1:10 V/V) methanolic leaf extract of Cistus monspeliensis in negative ionization mode.
Figure 2
Figure 2
(A) Viability (% of DMSO control) of CHO-K1 cells after 24 h incubation with different concentrations of C. monspeliensis methanolic extract (9.4–600 µg/mL). Data represent mean ± standard deviation of three independent experiments. (B) A nonlinear regression of log-transformed concentration values (curve fit) was applied to determine the IC50 value. The percentage of viable cells upon treatment was calculated using this equation: T/C × 100, where T stands for test sample and C for control. Statistical analysis was performed using GraphPad Prism Ver.7. ANOVA followed by Tukey multiple comparison post-test. Different symbols indicate significant differences from DMSO control (*** p = 0.0008; **** p < 0.0001).
Figure 3
Figure 3
(A): Percentage of cytotoxicity (%) CN (blue) and % CBPI (black) in CHO-K1 cells (B): % of binucleated cells in CHO-K1 cells after 24 h incubation with different concentrations of MMC, followed by 24 h incubation with 3 μg/mL of cytochalasin B. Graphs represent data collected from three independent experiments. One-way ANOVA, Tukey’s multiple comparisons test using GraphPad Prism 7 software was applied to calculate statistical significance in comparison with NC. (**** p < 0.0001).
Figure 4
Figure 4
(A) Percentage of cytotoxicity (%) CN (blue) and CBPI (black) in CHO-K1 cells; (B) % of binucleated cells in CHO-K1 cells after 24 h incubation with different concentrations of C. monspeliensis extract, followed by 24 h incubation with 3 μg/mL of cytochalasin B. Graphs represent data collected from three independent experiments. One-way ANOVA, Tukey’s multiple comparisons test using GraphPad Prism 7 software was applied to calculate statistical significance in comparison with NC.
Figure 5
Figure 5
(A): Micronuclei frequency in CHO-K1cells after 24 h incubation with three different concentrations of C. monspeliensis extract, followed by 24 h incubation with 3 μg/mL of cytochalasin B. Graphs represent data collected from three independent experiments. One-way ANOVA, Tukey’s multiple comparisons test using GraphPad Prism 7 software was applied to calculate statistical significance in comparison with NC (**** p < 0.0001). Micronuclei frequency (%) = (binucleated cells with MN/cells × 100). (B): Representative microscopic images of micronuclei formation in binucleated CHO-K1 cells with 40× objective after 24 h incubation with NC, MMC and C. monspeliensis at 50 and 200 μg/mL. CHO-K1 cell DNA was stained with bisbenzimide (Hoechst dye no. 33258). The white arrows showed the micronuclei. The white line in the image shows the scale bar = 50 µm.
Figure 6
Figure 6
(A): Percentage of cytotoxicity (%) CN (blue) and CBPI (red) in CHO-K1 cells. (B) % of binucleated cells in CHO-K1 cells after 24 h incubation with different concentrations of C. monspeliensis extract in the presence of 0.025 μg/mL MMC followed by 24 h incubation with 3 μg/mL of cytochalasin B. Graphs represent data collected from three independent experiments. One-way ANOVA, Tukey’s multiple comparisons test using GraphPad Prism 7 software was applied to calculate statistical significance in comparison with MMC control. ** p = 0.0020, *** p = 0.0001, **** p < 0.0001.
Figure 7
Figure 7
(A) Micronuclei frequency in CHO-K1 cells after 24 h incubation with three different concentrations of C. monspeliensis extract in the presence of MMC at 0.025 μg/mL, followed by 24 h incubation with 3 μg/mL of cytochalasin B. Graphs represent data collected from three independent experiments. One-way ANOVA, Tukey’s multiple comparisons test using GraphPad Prism 7 software was applied to calculate statistical significance in comparison with MMC control. * p < 0.0492, *** p = 0.0001. (B) Representative microscopic images of for micronuclei formation in binucleated CHO-K1 cells with 40× objective after 24 h incubation with 0.025 μg/mL MMC alone or MMC + C. monspeliensis at 5, 100, and 200 μg/mL. CHO-K1 cell DNA was stained with bisbenzimide (Hoechst dye no. 33258). The white arrows showed the micronuclei. The white line in the image shows the scale bar = 50 µm.
Figure 8
Figure 8
Micronuclei frequency (normalized with NC) per 2000 binucleated CHO-K1cells after 24 h incubation with three different concentrations (50, 100, and 200 μg/mL) of C. monspeliensis extract, followed by 24 h incubation with 3 μg/mL of cytochalasin B. Graphs represent data collected from three independent experiments. One-way ANOVA, Tukey’s multiple comparisons test using GraphPad Prism 7 software was applied to calculate statistical significance in comparison with NC control. Micronuclei frequency (%) = (binucleated cells with MN/binucleated cells × 100). * p = 0.0192, *** p = 0.0001, **** p < 0.0001.
Figure 9
Figure 9
Representative images captured by the ImageStreamX, with 40× objective, that show bright field (a) image of single cells, (b): Ch05, binucleated cells with micronuclei with or without micronuclei stained with Draq5 of NC, C. monspeliensis extract at tested concentrations of 50 and 200 μg/mL in presence or absence of MMC at 0.025 μg/mL, (c) represents side scatter (SSC) image of each cell.
Figure 10
Figure 10
Representative steps for micronuclei analysis using the CellProfiler software (version number 4.2.6): (a) Raw image obtained from widefield microscope acquisition. (b) Deconvolved image obtained from Leica Lightning software tool. (c) Processed image (image crop, smoothing filter, noise-reduction filter) obtained from CellProfiler. (d) Nuclei segmentation obtained from CellProfiler. (e) Nuclei splitting into classes (mononucleated and binucleated cells) obtained from CellProfiler. (f) Definition of cell boundaries (secondary objects), expanding nuclei for a specific distance, obtained from CellProfiler. (g) Definition of cell cytoplasm (tertiary objects) obtained from CellProfiler. (h) Micronuclei segmentation, obtained from CellProfiler. (i) Filtered micronuclei assigned to the nucleus they belong to, obtained from CellProfiler. (j) Outlines of mononucleated and binucleated cells overlayed to (c).
Figure 11
Figure 11
Representative steps of micronuclei analysis using the IDEAS Software (version number 6.2). (a) During the analysis, first, selection was based on the Gradient_RMS parameter to confirm in-focus events in the brightfield channel (BF, Ch01). (b) A dot plot of Draq5 lobe count versus aspect ratio was created: the reported gates include all cells with two Draq5-stained nuclei, two lobes, single lobe, and cells with more than two nuclei. (c) A histogram of BF Aspect Ratio, displaying the gate used to discriminate single cells: all events with Aspect Ratio higher than 0.5 were considered for defining bi-nucleated cells in the histogram reported in (d) that used Draq5 Area for this purpose. (e) Dot plot of Draq5 Width versus Homogeneity parameters, where the blue gate includes cells with more uniform distribution of Draq5 stain: the majority of the events of interest showed Homogeneity greater than 10 and Width greater than 15. (f) Previous Homog/Width population was considered in a dot plot of Draq5 Aspect Ratio intensity versus Draq5-Compactness to finally define the gate that encompasses the acceptable BNC population (yellow gate). Each sample was checked to better define each single gate, evaluating each single event. (g) A histogram of our specific spot count feature (micronuclei_Count_A) generated over the masks described in Materials and Methods and in Supplementary Data (2). The linear gates over each bar display the number of BNCs without micronuclei (0 micronuclei) and, respectively, with 1, 2, and 3 micronuclei. The normalized frequency represents the percentage of each type of cell among the total number of cells in the BNC population. BF = brightfield channel, BN = binucleated cells, BNC = binucleated cells with micronuclei.
Figure 12
Figure 12
Mask staining (blue shadows over the images): (a) Ch01, brightfield (BF) image with the default mask applied that stains all the picture; (b) Ch05, binucleated cells with micronuclei (BNC) with a single micronucleus stained with Draq5 with the nuclear mask applied (micronuclei _MaskB_Step3, see Supplementary Data); (c) Ch05, BNC with a single micronucleus stained with Draq5 with the complete micronuclei mask applied (micronuclei _MaskA_Step3 and Not micronuclei _MaskB_Step3, see Supplementary Data).

Similar articles

Cited by

References

    1. Tomou E.M., Lytra K., Rallis S., Tzakos A.G., Skaltsa H. An Updated Review of Genus Cistus L. since 2014: Traditional Uses, Phytochemistry, and Pharmacological Properties. Phytochem. Rev. 2022;21:2049–2087. doi: 10.1007/s11101-022-09827-y. - DOI
    1. Bouamama H., Noël T., Villard J., Benharref M., Jana A. Antimicrobial activities of the leaf extracts of two Moroccan Cistus L. Species. J. Ethnopharmacol. 2006;1041:04–107. doi: 10.1016/j.jep.2005.08.062. - DOI - PubMed
    1. Loizzo M.R., Ben Jemia M., Senatore F., Bruno M., Menichini F., Tundis R. Chemistry and functional properties in pre-vention of neurodegenerative disorders of five Cistus species essential oils. Chem. Toxicol. 2013;59:586–594. doi: 10.1016/j.fct.2013.06.040. - DOI - PubMed
    1. Ledrhem M., Nakamura M., Obitsu M., Hirae K., Kameyama J., Bouamama H., Gadhi C., Katakura Y. Essential Oils De-rived from Cistus Species Activate Mitochondria by Inducing SIRT1 Expression in Human Keratinocytes, Leading to Senescence Inhibition. Molecules. 2022;27:2053. doi: 10.3390/molecules27072053. - DOI - PMC - PubMed
    1. Sayah K., Chemlal L., Marmouzi I., El Jemli M., Cherrah Y., Faouzi M.E.A. In Vivo Anti-Inflammatory and Analgesic Ac-tivities of Cistus salviifolius (L.) and Cistus monspeliensis (L.) Aqueous Extracts. S. Afr. J. Bot. 2017;113:160–163. doi: 10.1016/j.sajb.2017.08.015. - DOI

LinkOut - more resources