. 2024 Dec 21;15(12):1521.
doi: 10.3390/mi15121521.

A Novel Microfluidic Platform for Personalized Anticancer Drug Screening Through Image Analysis

Affiliations

A Novel Microfluidic Platform for Personalized Anticancer Drug Screening Through Image Analysis

Maria Veronica Lipreri et al. Micromachines (Basel). .

Abstract

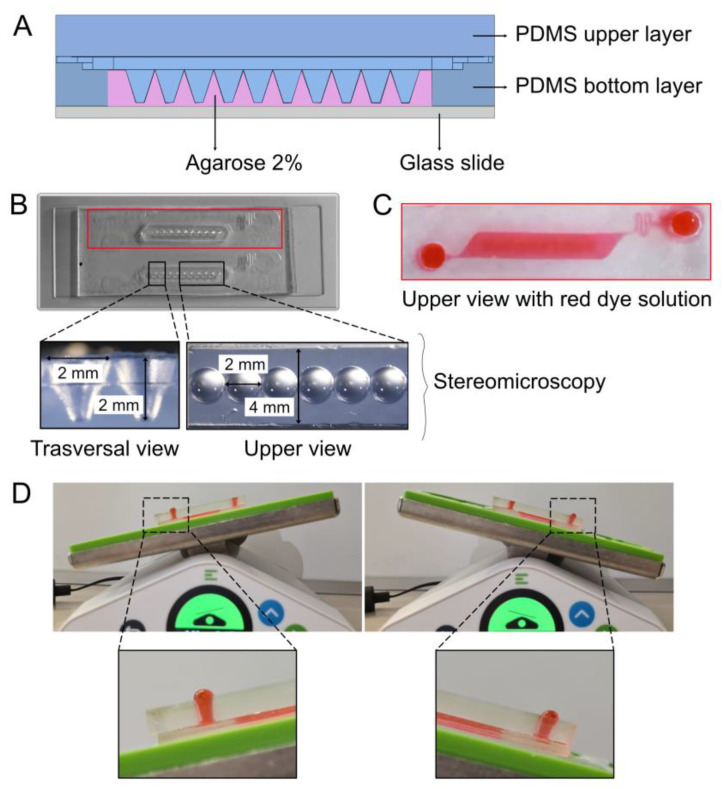
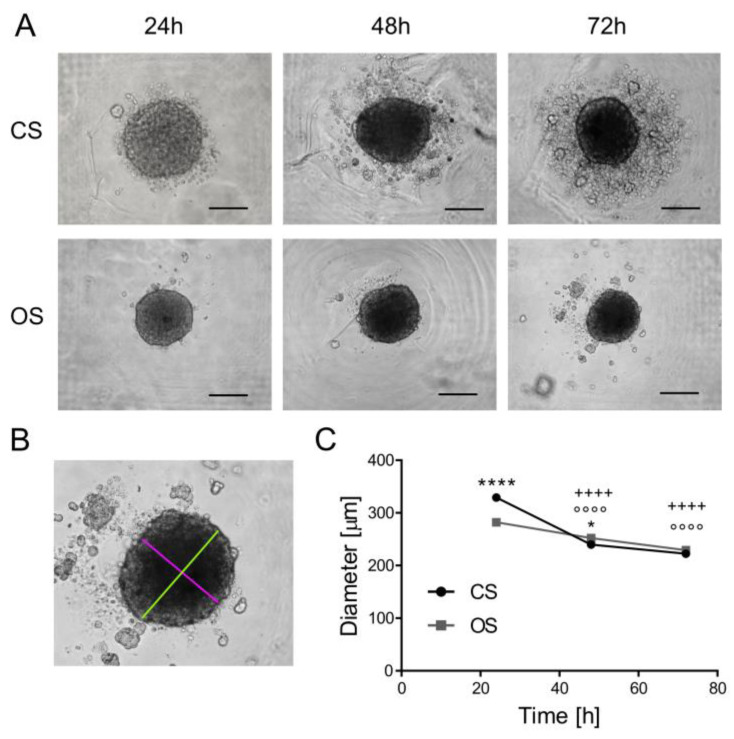
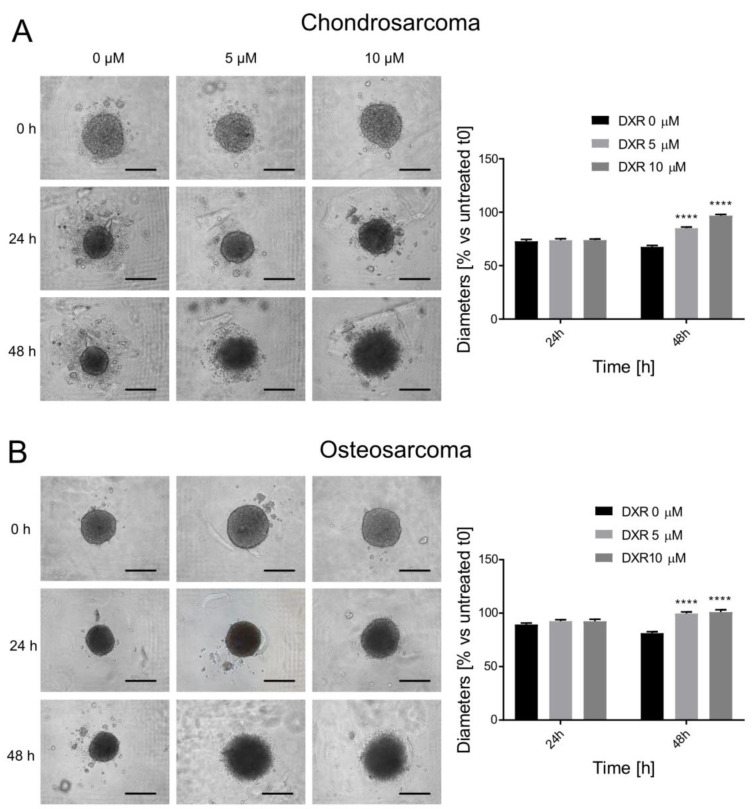
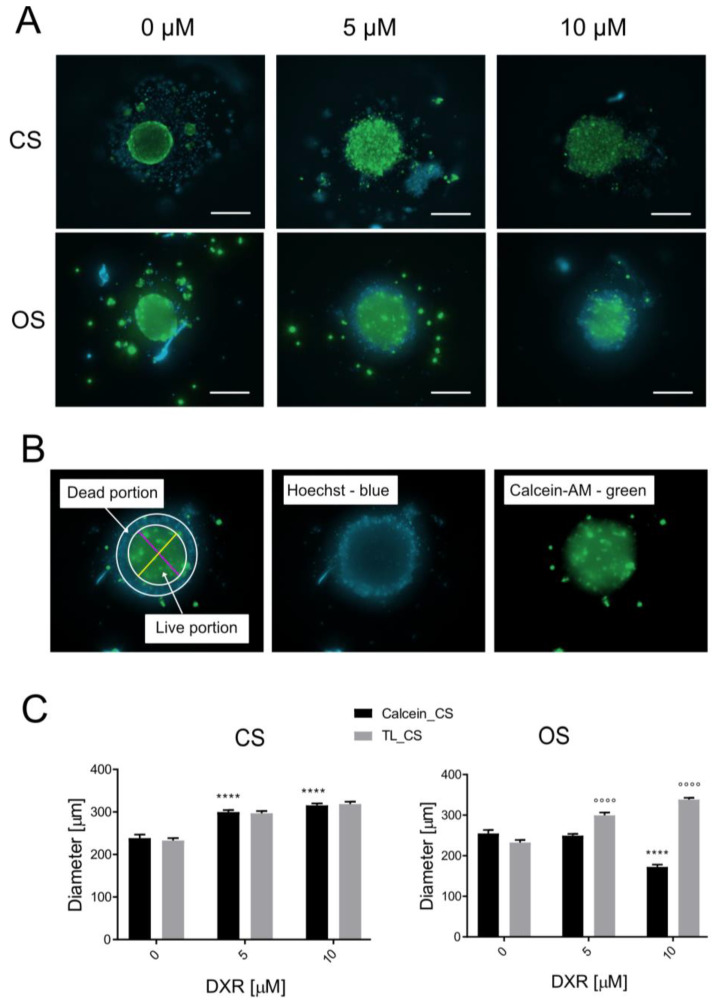
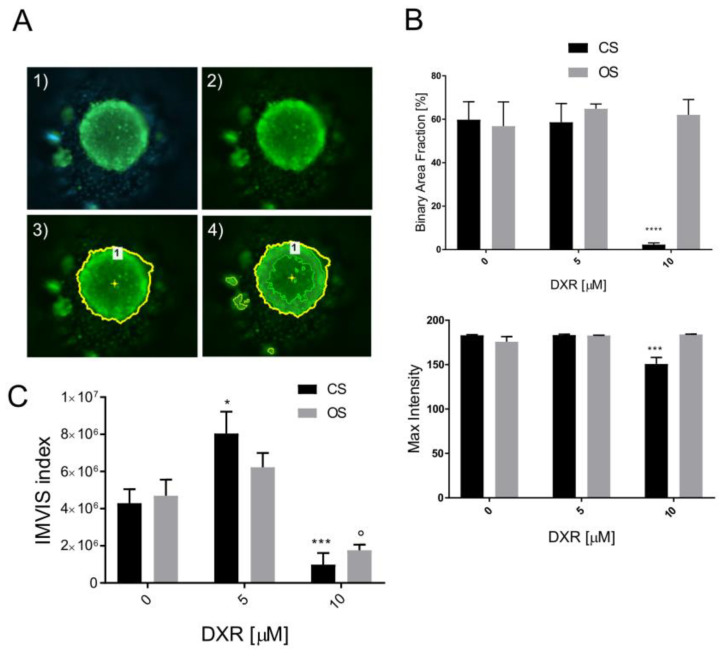
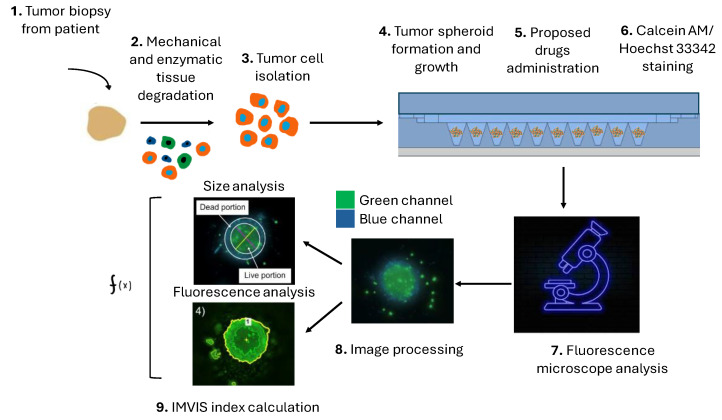
The advancement of personalized treatments in oncology has garnered increasing attention, particularly for rare and aggressive cancer with low survival rates like the bone tumors osteosarcoma and chondrosarcoma. This study introduces a novel PDMS-agarose microfluidic device tailored for generating patient-derived tumor spheroids and serving as a reliable tool for personalized drug screening. Using this platform in tandem with a custom imaging index, we evaluated the impact of the anticancer agent doxorubicin on spheroids from both tumor types. The device produces 20 spheroids, each around 300 µm in diameter, within a 24 h timeframe, facilitating assessments of characteristics and reproducibility. Following spheroid generation, we measured patient-derived spheroid diameters in bright-field images, calcein AM-positive areas/volume, and the binary fraction area, a metric analyzing fluorescence intensity. By employing a specially developed equation that combines viability signal extension and intensity, we observed a substantial decrease in spheroid viability of around 75% for both sarcomas at the highest dosage (10 µM). Osteosarcoma spheroids exhibited greater sensitivity to doxorubicin than chondrosarcoma spheroids within 48 h. This approach provides a reliable in vitro model for aggressive sarcomas, representing a personalized approach for drug screening that could lead to more effective cancer treatments tailored to individual patients, despite some implementation challenges.

Keywords: chondrosarcoma; drug screening; microfluidics; osteosarcoma; personalized medicine.


Conflict of interest statement

The authors declare no conflicts of interest.

Figures

Figure 1
Figure 1
Development and characterization of the spheroid-containing microfluidic platform. (A) Schematic of the microfluidic device, comprising a PDMS bottom layer bonded to a glass slide, a microstructured agarose compartment with cone-shaped wells on the surface, and an upper PDMS layer. (B) Image of the assembled microfluidic device. On the bottom, enlarged images acquired by stereomicroscopy of the cone-shaped wells (transversal view, 2×, Upper view 1×). (C) A red dye loaded in the microfluidic device proves absence of leakages at the macroscopic level. (D) Images of the microfluidic device on the OrganoFlow® showcase the correct fluid flow and the absence of leakages during the tilting process at a macroscopic level.
Figure 2
Figure 2
Formation, growth, and characterization of OS and CS spheroids. (A) Representative images of spheroids (transmitted light microscopy) at 24–48–72 h post seeding in the microfluidic device (magnification 10×, scale bar 200 μm). (B) Representative image of spheroid size measurement, where the maximum diameter (green line) and minimum diameter (red line) were manually traced and calculated using ImageJ software. (C) Graph of the diameters of the spheroids, obtained by manual quantification (ImageJ software). Means ± SEM (Mann–Whitney U test, * p < 0.5, **** p < 0.0001, OS vs. CS at the respective time points, and ++++ p < 0.0001 for CS vs. 24 h, °°°° p < 0.0001 for OS vs. 24 h).
Figure 3
Figure 3
Drug screening assay based on transmitted light images of treated OS (A) and CS (B) spheroids. On the left, representative images of spheroids before DXR treatment (0 h) and after treatment (24 h and 48 h) at different doses (0–5–10 μM). Magnification 10×, scale bar 200 μm. On the right, graphs of the percentage of DXR-treated spheroid size in respect to untreated spheroids (treated vs. untreated, **** p < 0.0001).
Figure 4
Figure 4
Drug screening assay based on quantification of the fluorescent images of OS and CS spheroids treated for 48 h with DXR (0–5–10 Μm) and positive for calcein AM staining. Hoechst 33342/calcein AM staining distinguished dead cells (Hoechst+ only, blue) from live cells (Hoechst 33342+ and calcein AM+, green). (A) Representative images of treated CS and OS spheroids. Images were acquired with ImageXpress PICO machine (magnification 4×, scale bar 200 μm); (B) a representative image of spheroid size measurement: maximum diameter (purple line) and minimum diameter (yellow line) manually traced and processed with ImageJ software; (C) graph of the average diameter obtained on the calcein AM-positive portion of the fluorescence images (black bars) and on transmitted light images (gray bars) (treated vs. untreated, **** p < 0.0001, and diameters measured on bright-field vs. calcein AM signals at the respective DXR dosage, °°°° p < 0.0001).
Figure 5
Figure 5
Drug screening assay based on quantification of the BAF of highest intensity range for calcein AM staining of OS and CS spheroids, treated for 48 h with DXR. (A) Schematic of method to calculate the BAF and maximum intensity: (1). load fluorescence image for NIS Elements AR 5.40.01 software analysis; (2). select green fluorescence channel: (3). select ROI, corresponding to the green-stained spheroid area; (4). define area within ROI where green channel fluorescence exceeds selected threshold. (B) Graphs showing BAF and the maximum intensity for DXR treated vs. untreated spheroids (*** p < 0.001, **** p < 0.0001). (C) Graph of IMVIS of DXR-treated spheroids, calculated by multiplying calcein AM-positive assumed volume and BFA (treated vs. untreated, * p < 0.05, *** p < 0.001, ° p < 0.05).
Figure 6
Figure 6
The step-by-step process envisioned for the personalized therapeutic approach, founded on our microfluidic device for generating patient-derived spheroids and their image analysis, progressing from patient’s bedside to tailored outcomes on individualized anticancer therapies. First, a biopsy is taken from the patient (1), it is mechanically and enzymatically degraded (2) and only tumor cells are isolated (3). The tumor cells are then seeded in the platform (4) to obtain spheroids from patient cells and, once the spheroids are formed, a chemotherapeutic drug is administered (5). After the treatment, a live staining is performed (6), and images are subsequently acquired using a fluorescence microscope (7), processed (8), and analyzed with IMVIS index (9) to evaluate the proportion of live and dead cells within the spheroid.

Similar articles

Cited by

References

    1. Lin F., Lin E.Z., Anekoji M., Ichim T.E., Hu J., Marincola F.M., Jones L.D., Kesari S., Ashili S. Advancing personalized medicine in brain cancer: Exploring the role of mRNA vaccines. J. Transl. Med. 2023;21:830. doi: 10.1186/s12967-023-04724-0. - DOI - PMC - PubMed
    1. Strianese O., Rizzo F., Ciccarelli M., Galasso G., D’Agostino Y., Salvati A., Del Giudice C., Tesorio P., Rusciano M.R. Precision and Personalized Medicine: How Genomic Approach Improves the Management of Cardiovascular and Neurodegenerative Disease. Genes. 2020;11:747. doi: 10.3390/genes11070747. - DOI - PMC - PubMed
    1. Liu Y., Wu W., Cai C., Zhang H., Shen H., Han Y. Patient-derived xenograft models in cancer therapy: Technologies and applications. Signal Transduct. Target. Ther. 2023;8:160. doi: 10.1038/s41392-023-01419-2. - DOI - PMC - PubMed
    1. Abdolahi S., Ghazvinian Z., Muhammadnejad S., Saleh M., Asadzadeh Aghdaei H., Baghaei K. Patient-derived xenograft (PDX) models, applications and challenges in cancer research. J. Transl. Med. 2022;20:206. doi: 10.1186/s12967-022-03405-8. - DOI - PMC - PubMed
    1. Zhang S., Bamakan S.M.H., Qu Q., Li S. Learning for Personalized Medicine: A Comprehensive Review From a Deep Learning Perspective. IEEE Rev. Biomed. Eng. 2019;12:194–208. doi: 10.1109/RBME.2018.2864254. - DOI - PubMed

LinkOut - more resources