

Diagnostic Accuracy of Mycobacterium tuberculosis Antigen-Based Skin Tests (TBSTs) for Tuberculosis Infection Compared with TST and IGRA: A Network Meta-Analysis
- PMID: 39770310
- PMCID: PMC11728611
- DOI: 10.3390/pathogens13121050
Diagnostic Accuracy of Mycobacterium tuberculosis Antigen-Based Skin Tests (TBSTs) for Tuberculosis Infection Compared with TST and IGRA: A Network Meta-Analysis
Abstract
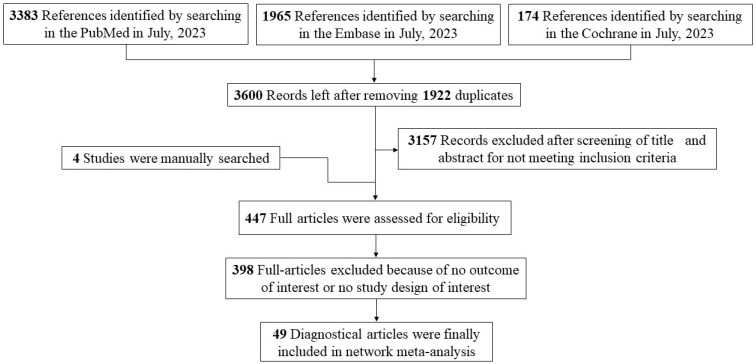
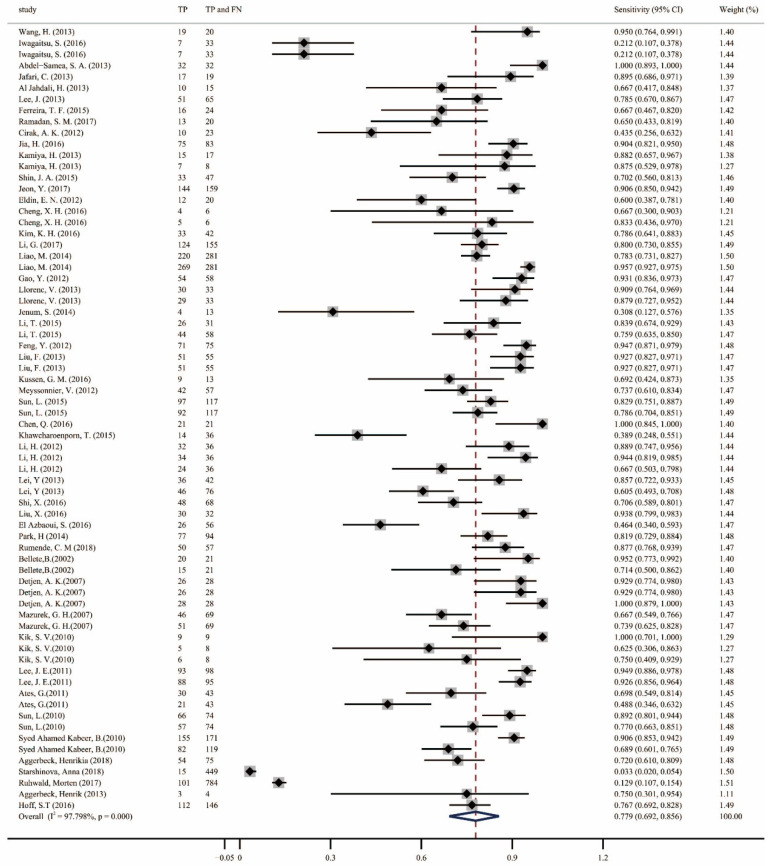
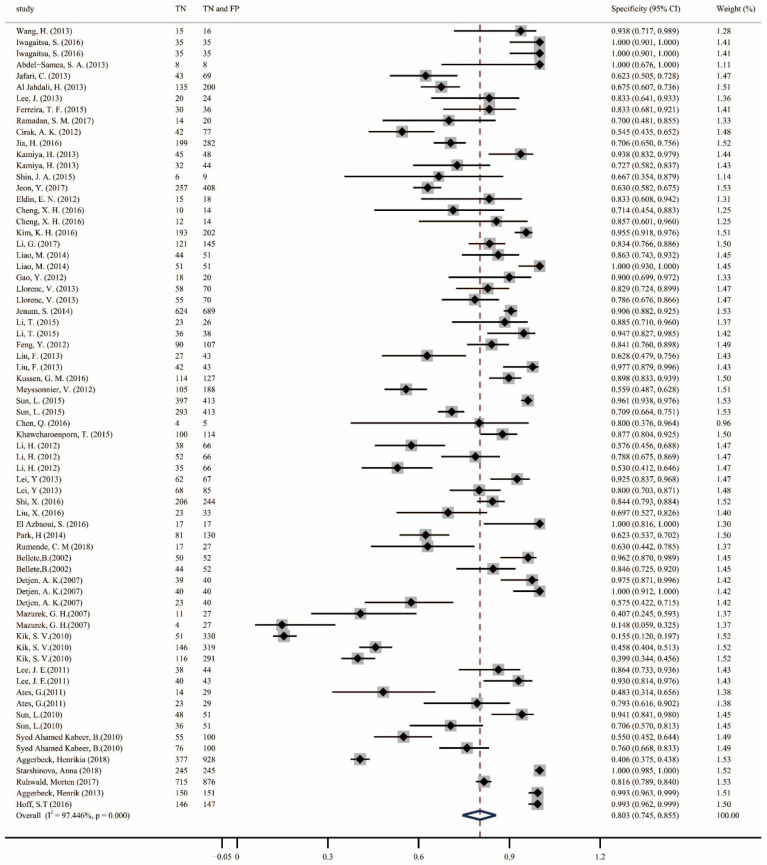
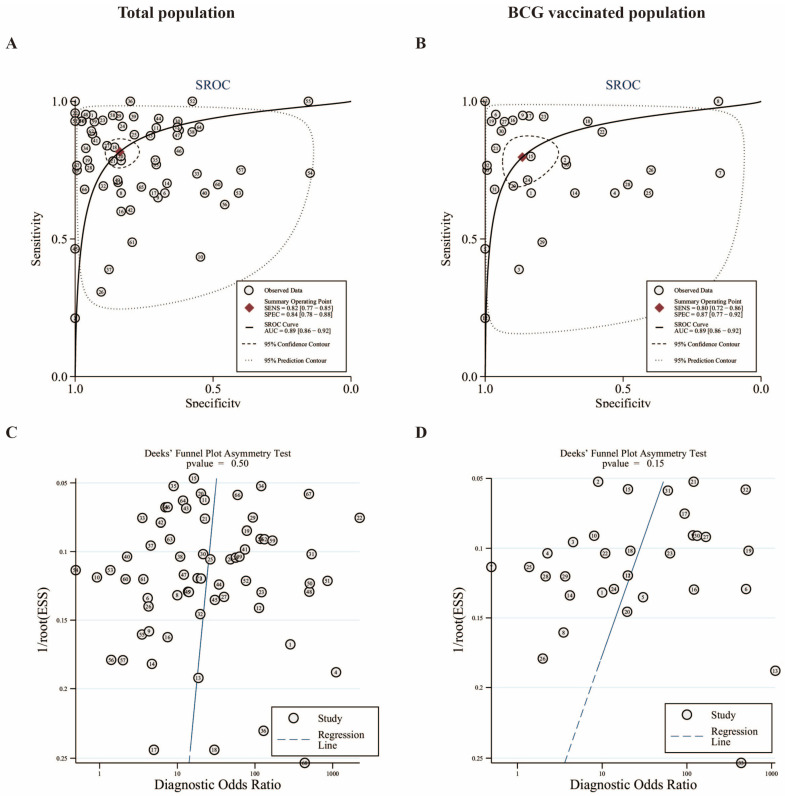
The aim of this study was to evaluate the diagnostic accuracy of the IGRA, TST, and TBST by combining diagnostic test accuracy (DTA) analysis and network meta-analysis (NMA) to increase the reliability and accuracy of diagnostic methods and promote the eradication of TB. An electronic search of the PubMed, Embase, and Cochrane databases was conducted, from the date of establishment to September 30, 2024. Data were synthesized with frequentist random-effects network meta-analyses, a single-group rate meta-analysis algorithm, and a bivariate mixed-effects logistic regression model. Summarized receiver operating characteristic curves and Fagan nomograms were used to assess diagnostic accuracy and clinical utility. Deeks' funnel plots and the Quality Assessment of Diagnostic Accuracy Studies 2 tools were used to assess publication bias and risk of bias. Sources of heterogeneity were investigated using subgroup analyses. Forty-nine studies were identified. The diagnostic performance of the three diagnostic methods for TB infection is summarized as follows: the pooled sensitivity was 77.9% (95% confidence interval [CI], 0.69-0.856), and the pooled specificity was 80.3% (95% CI, 0.75-0.86). The sensitivity and specificity of the IGRA were 82.1% (95% CI, 0.78-0.86) and 81.1% (95% CI, 0.75-0.86), respectively, both higher than the TST. However, the TBST exhibited the highest specificity, at 98.5% (95% CI, 0.96-1.00), with a sensitivity of 78.7% (95% CI, 0.68-0.88), which was between that of the IGRA and TST. Subgroup analysis found that population categories and reference standards, among other factors, may be attributed to heterogeneity. In addition, the TST and IGRA add-on TBST can significantly improve diagnostic accuracy. In our study, the IGRA showed higher sensitivity, whereas the TBST showed higher specificity. Interestingly, under certain conditions, TST add-on TBST and IGRA add-on TBST showed better accuracy than TST and IGRA alone and could provide more effective guidance for clinical practice (PROSPERO CRD42023420136).
Keywords: IGRA; TST; diagnosis; diagnostic test accuracy; meta-analysis; the Mycobacterium tuberculosis antigen-based skin test; tuberculosis.
Conflict of interest statement
The authors declare no conflicts of interest.
Figures

Similar articles
-
The diagnostic performance of novel skin-based in-vivo tests for tuberculosis infection compared with purified protein derivative tuberculin skin tests and blood-based in vitro interferon-γ release assays: a systematic review and meta-analysis.Lancet Infect Dis. 2022 Feb;22(2):250-264. doi: 10.1016/S1473-3099(21)00261-9. Epub 2021 Oct 1. Lancet Infect Dis. 2022. PMID: 34606768
-
Agreement between Mycobacterium tuberculosis antigen-based skin test and interferon-gamma release assay in elderly individuals aged ≥65 years in China.Clin Microbiol Infect. 2025 Feb;31(2):290.e1-290.e3. doi: 10.1016/j.cmi.2024.10.016. Epub 2024 Oct 23. Clin Microbiol Infect. 2025. PMID: 39454755
-
Mycobacterial heparin-binding hemagglutinin (HBHA)-induced interferon-γ release assay (IGRA) for discrimination of latent and active tuberculosis: A systematic review and meta-analysis.PLoS One. 2021 Jul 16;16(7):e0254571. doi: 10.1371/journal.pone.0254571. eCollection 2021. PLoS One. 2021. PMID: 34270559 Free PMC article.
-
Host factors associated to false negative and indeterminate results in an interferon-γ release assay in patients with active tuberculosis.Pulmonology. 2020 Nov-Dec;26(6):353-362. doi: 10.1016/j.pulmoe.2019.11.001. Epub 2019 Dec 13. Pulmonology. 2020. PMID: 31843341
-
Evaluation of the QuantiFERON®-TB Gold In-Tube Assay and Tuberculin Skin Test for the Diagnosis of Latent Tuberculosis Infection in an Iranian Referral Hospital.Infect Disord Drug Targets. 2019;19(2):141-144. doi: 10.2174/1871526518666180228164036. Infect Disord Drug Targets. 2019. PMID: 29493468
Cited by
-
Diagnostic accuracy study of STANDARD TB-Feron FIA and STANDARD TB-Feron ELISA tests for tuberculosis infection diagnosis in Eastern European setting.J Clin Tuberc Other Mycobact Dis. 2025 Mar 14;39:100518. doi: 10.1016/j.jctube.2025.100518. eCollection 2025 May. J Clin Tuberc Other Mycobact Dis. 2025. PMID: 40177661 Free PMC article.
References
-
- WHO . Global Tuberculosis Report 2023. World Health Organization; Geneva, Switzerland: 2023.
-
- Domínguez J., Boeree M.J., Cambau E., Chesov D., Conradie F., Cox V., Dheda K., Dudnyk A., Farhat M.R., Gagneux S., et al. Clinical implications of molecular drug resistance testing for Mycobacterium tuberculosis: A 2023 TBnet/RESIST-TB consensus statement. Lancet Infect. Dis. 2023;23:e122–e137. doi: 10.1016/S1473-3099(22)00875-1. - DOI - PMC - PubMed
-
- Abdulkareem F.N., Merza M.A., Salih A.M. First insight into latent tuberculosis infection among household contacts of tuberculosis patients in Duhok, Iraqi Kurdistan: Using tuberculin skin test and QuantiFERON-TB Gold Plus test. Int. J. Infect. Dis. 2020;96:97–104. doi: 10.1016/j.ijid.2020.03.067. - DOI - PubMed
Publication types
MeSH terms
Substances
Grants and funding
- 81860644/National Natural Science Foundation of China
- 82160304/National Natural Science Foundation of China
- 82460398/National Natural Science Foundation of China
- 202401AY070001-211/Joint fundation of Yunnan Province Department of Science, Technology-Kunming Medical University
- 2023J0215/Yunnan Provincial Department of Education Science Research Fund Project
LinkOut - more resources
Full Text Sources
Medical
