

The Impact of Mycobacterium avium subsp. paratuberculosis on Intestinal Microbial Community Composition and Diversity in Small-Tail Han Sheep
- PMID: 39770377
- PMCID: PMC11680033
- DOI: 10.3390/pathogens13121118
The Impact of Mycobacterium avium subsp. paratuberculosis on Intestinal Microbial Community Composition and Diversity in Small-Tail Han Sheep
Abstract
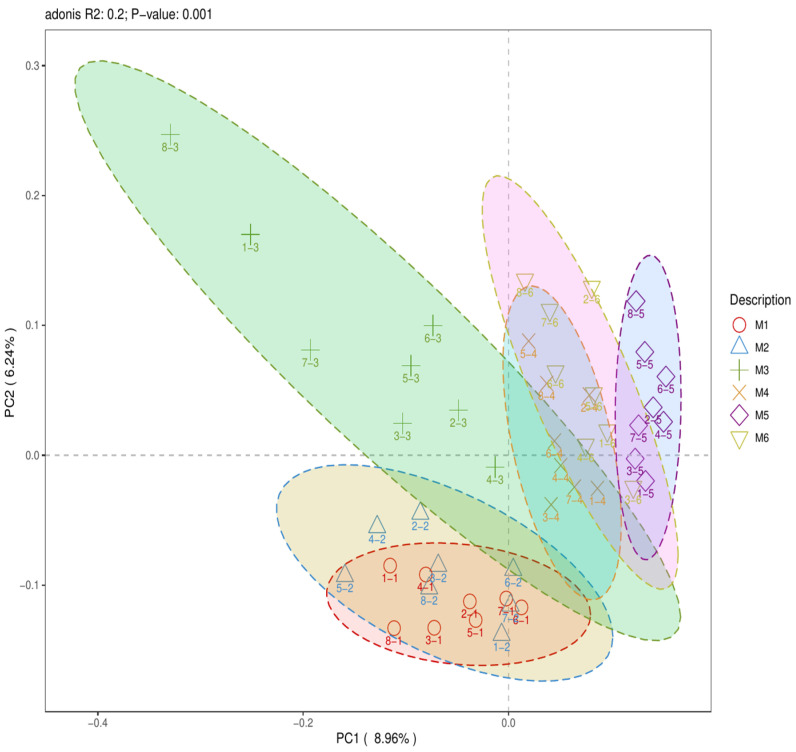
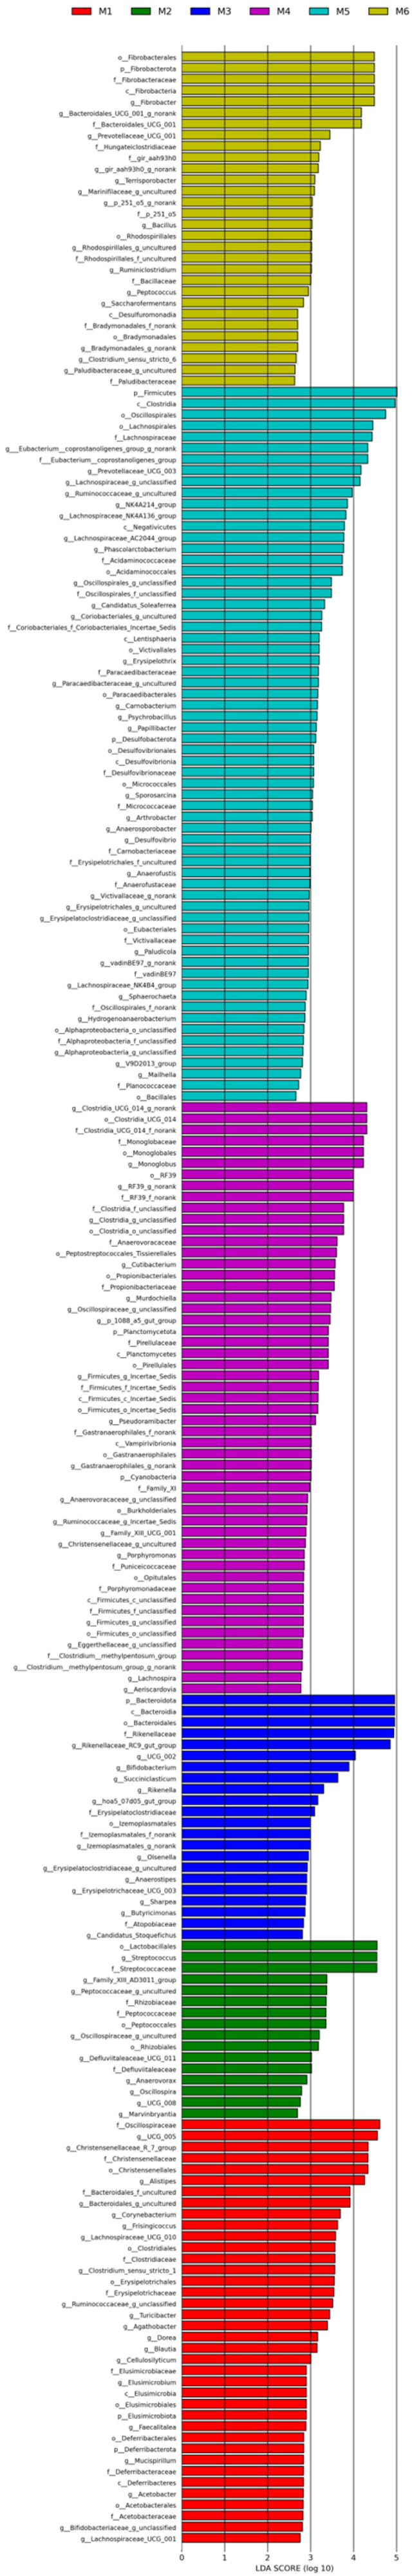
Paratuberculosis (PTB), primarily caused by Mycobacterium avium subsp. paratuberculosis (MAP), is a chronic infection that affects ruminants and is difficult to prevent, diagnose, and treat. Investigating how MAP infections affect the gut microbiota in sheep can aid in the prevention and treatment of ovine PTB. This study examined fecal samples from eight small-tail Han sheep (STHS) at various stages of infection and from three different field areas. All samples underwent DNA extraction and 16S rRNA sequencing. Among all samples, the phyla p. Firmicutes and p. Bacteroidota exhibited the highest relative abundance. The dominant genera in groups M1-M6 were UCG-005, Christensenellaceae_R-7_group, Rikenellaceae_RC9_gut_group, Akkermansia, UCG-005, and Bacteroides, whereas those in groups A-C were Christensenellaceae_R-7_group, Escherichia-Shigella, and Acinetobacter, respectively. The microbial community structure varied significantly among groups M1-M6. Specifically, 56 microbiota consortia with different taxonomic levels, including the order Clostridiales, were significantly enriched in groups M1-M6, whereas 96 microbiota consortia at different taxonomic levels, including the family Oscillospiraceae, were significantly enriched in groups A-C. To the best of our knowledge, this is the first study to report that MAP infection alters the intestinal microbiota of STHS. Changes in p. Firmicutes abundance can serve as a potential biomarker to distinguish MAP infection and determine the infection stage for its early diagnosis. Our study provides a theoretical basis for the treatment of PTB by regulating the intestinal microbiota, including p. Firmicutes.
Keywords: China; Mycobacterium avium subsp. paratuberculosis; high-throughput sequencing; microbial population; small-tail Han sheep.
Conflict of interest statement
The authors declare that they have no competing interests.
Figures
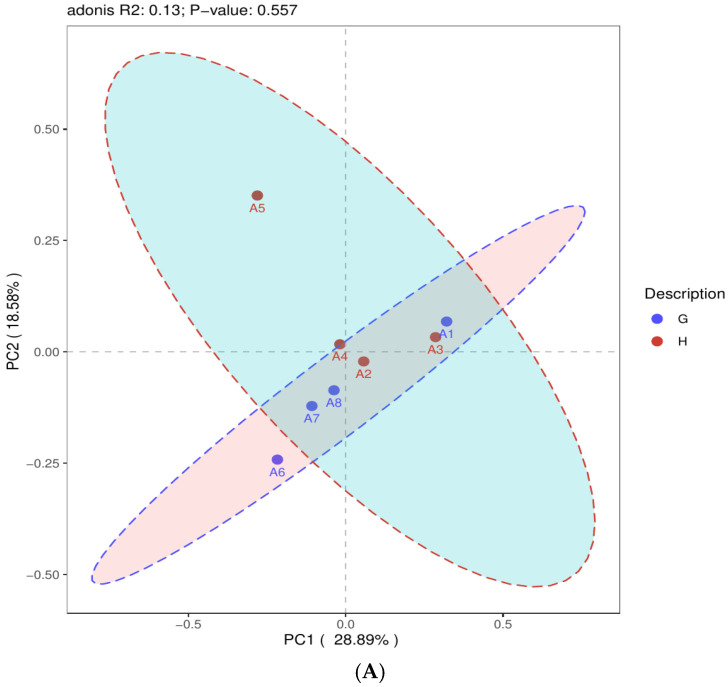
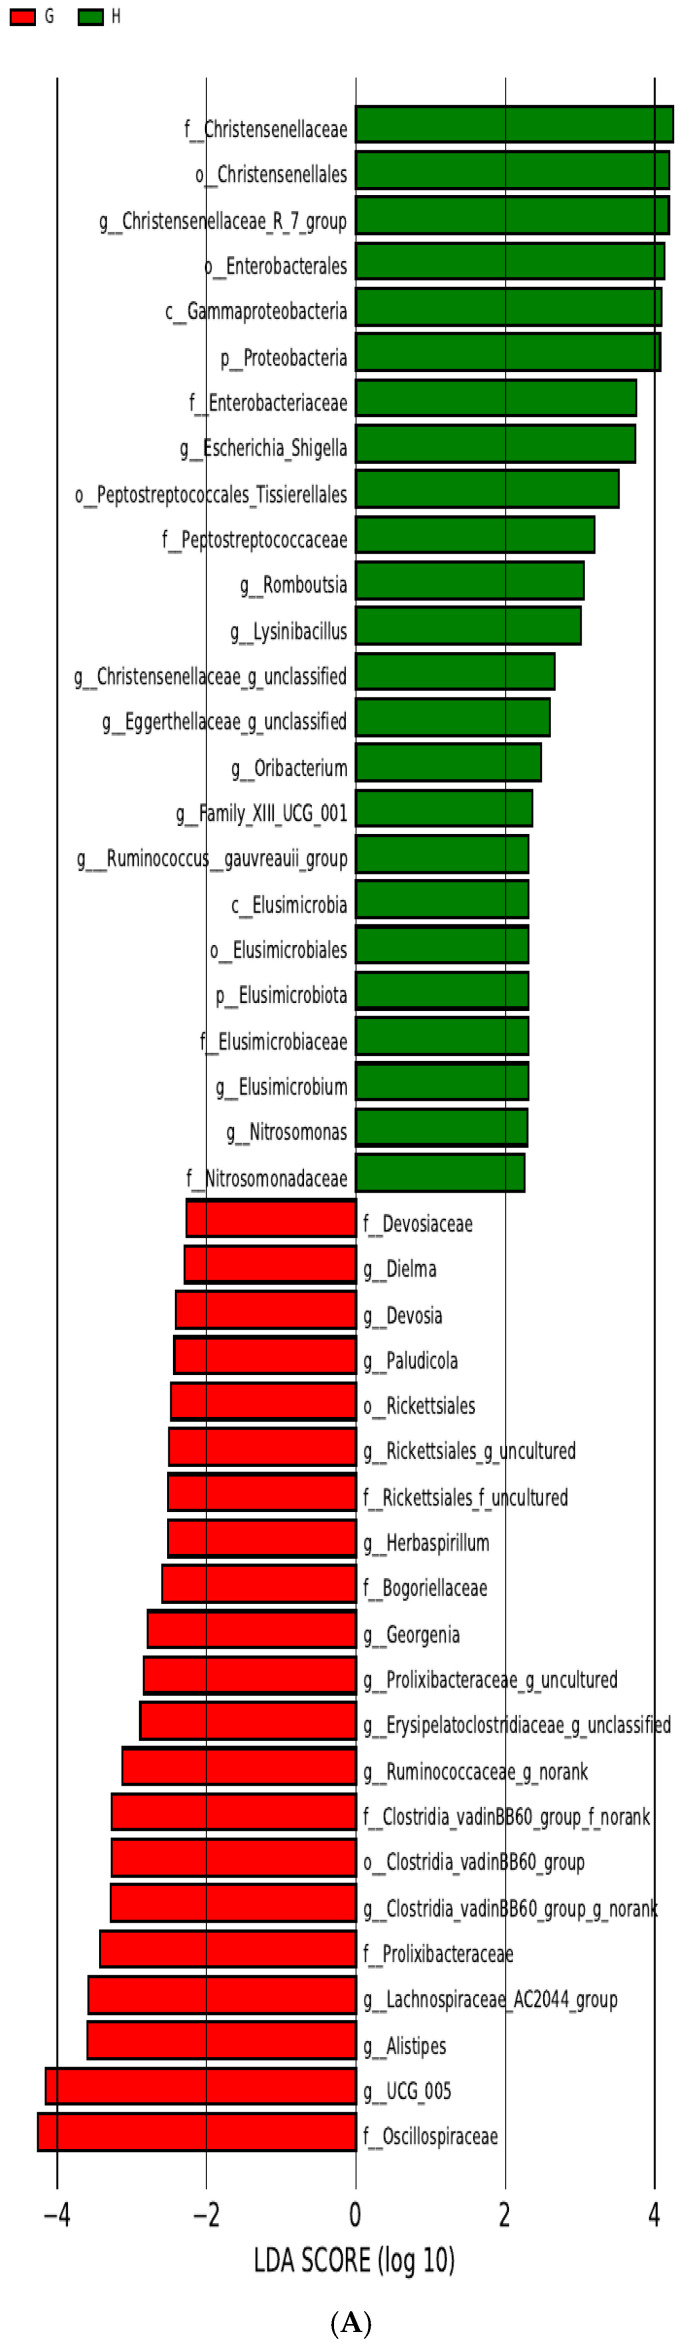
 ) (G): MAP-negative samples. Green rectangle (
 ) (H): MAP-positive samples. (B). LDA analysis of group B. Green rectangle (
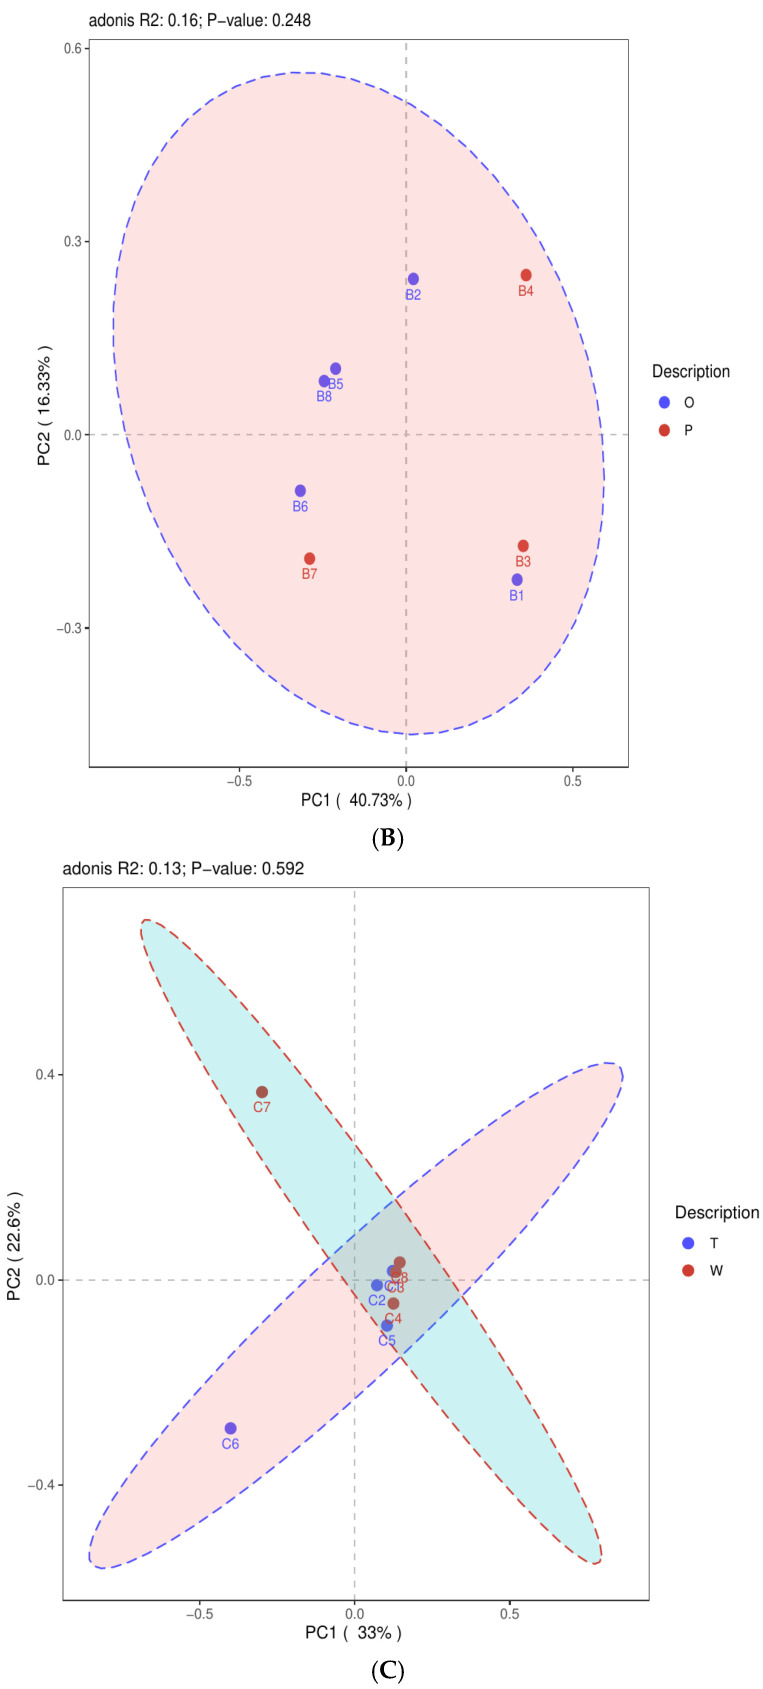
 ) (P): MAP-negative samples. Red rectangle (
 ) (O): MAP-positive samples. (C). LDA analysis of group C. Green rectangle (
 ) (W): MAP-negative samples. Red rectangle (
 ) (T): MAP-positive samples.
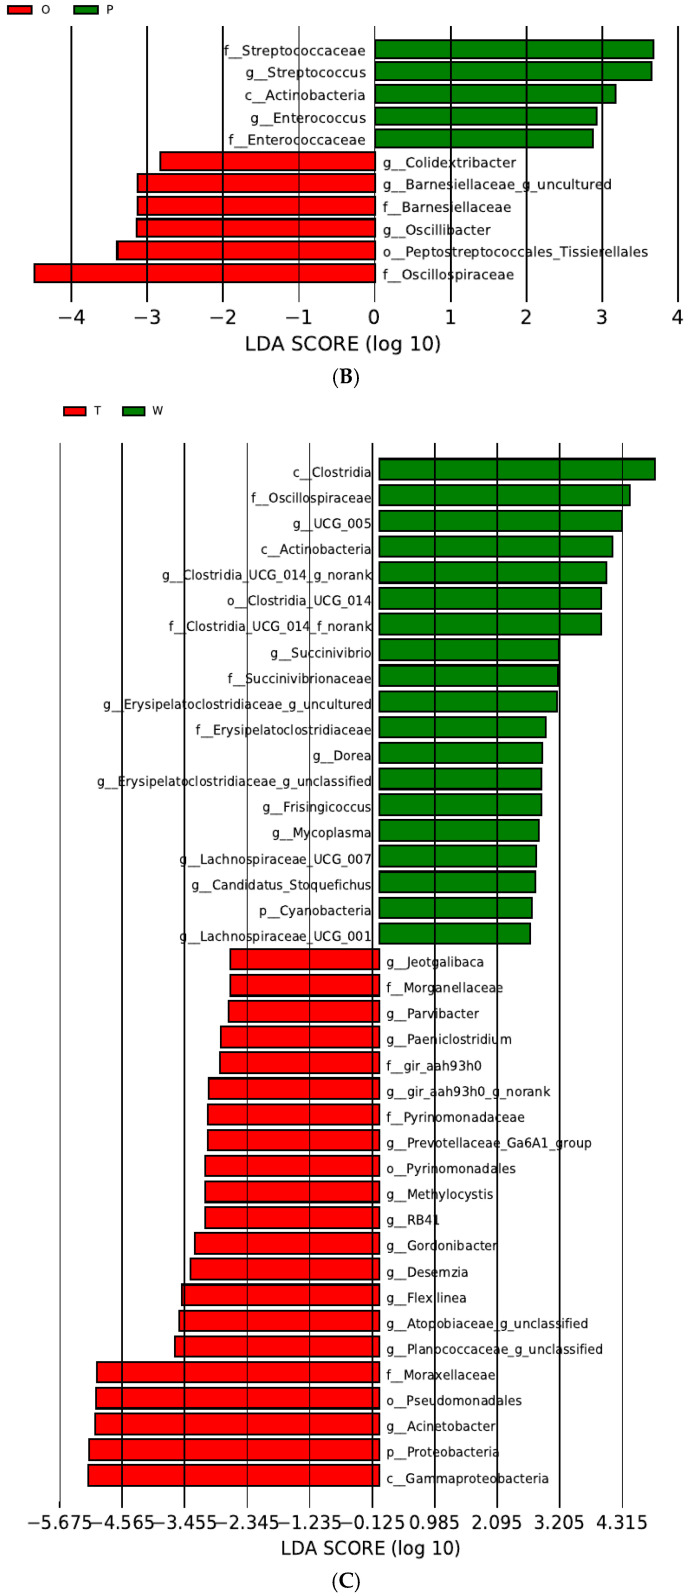 ) (G): MAP-negative samples. Green rectangle () (H): MAP-positive samples. (B). LDA analysis of group B. Green rectangle () (P): MAP-negative samples. Red rectangle () (O): MAP-positive samples. (C). LDA analysis of group C. Green rectangle () (W): MAP-negative samples. Red rectangle () (T): MAP-positive samples.
Similar articles
-
Faecal microbial diversity in a cattle herd infected by Mycobacterium avium subsp. paratuberculosis: a possible effect of production status.World J Microbiol Biotechnol. 2024 Jul 22;40(9):276. doi: 10.1007/s11274-024-04080-1. World J Microbiol Biotechnol. 2024. PMID: 39037634 Free PMC article.
-
A Machine Learning Approach Reveals a Microbiota Signature for Infection with Mycobacterium avium subsp. paratuberculosis in Cattle.Microbiol Spectr. 2023 Feb 14;11(1):e0313422. doi: 10.1128/spectrum.03134-22. Epub 2023 Jan 19. Microbiol Spectr. 2023. PMID: 36656029 Free PMC article.
-
Sheep challenged with sheep-derived type II Mycobacterium avium subsp. paratuberculosis: the first experimental model of paratuberculosis in China.BMC Vet Res. 2025 Apr 29;21(1):298. doi: 10.1186/s12917-025-04765-1. BMC Vet Res. 2025. PMID: 40301886 Free PMC article.
-
Evaluation of modified BACTEC 12B radiometric medium and solid media for culture of Mycobacterium avium subsp. paratuberculosis from sheep.J Clin Microbiol. 1999 Apr;37(4):1077-83. doi: 10.1128/JCM.37.4.1077-1083.1999. J Clin Microbiol. 1999. PMID: 10074529 Free PMC article.
-
A synthesis of the patho-physiology of Mycobacterium avium subspecies paratuberculosis infection in sheep to inform mathematical modelling of ovine paratuberculosis.Vet Res. 2018 Mar 7;49(1):27. doi: 10.1186/s13567-018-0522-1. Vet Res. 2018. PMID: 29514687 Free PMC article. Review.
Cited by
-
Prevalence and Genotyping of Mycobacterium avium subsp. paratuberculosis in Sheep from Inner Mongolia, China.Vet Sci. 2025 Apr 2;12(4):326. doi: 10.3390/vetsci12040326. Vet Sci. 2025. PMID: 40284828 Free PMC article.
References
-
- Sun W.W., Lv W.F., Cong W., Meng Q.F., Wang C.F., Shan X.F., Qian A.D. Mycobacterium avium Subspecies paratuberculosis and Bovine Leukemia Virus Seroprevalence and Associated Risk Factors in Commercial Dairy and Beef Cattle in Northern and Northeastern China. BioMed Res. Int. 2015;2015:315173. doi: 10.1155/2015/315173. - DOI - PMC - PubMed
MeSH terms
Substances
Grants and funding
LinkOut - more resources
Full Text Sources
Medical
