. 2024 Nov 22;17(12):1568.
doi: 10.3390/ph17121568.

Pyroptosis in Endothelial Cells and Extracellular Vesicle Release in Atherosclerosis via NF-κB-Caspase-4/5-GSDM-D Pathway

Affiliations

Pyroptosis in Endothelial Cells and Extracellular Vesicle Release in Atherosclerosis via NF-κB-Caspase-4/5-GSDM-D Pathway

Salman Shamas et al. Pharmaceuticals (Basel). .

Abstract

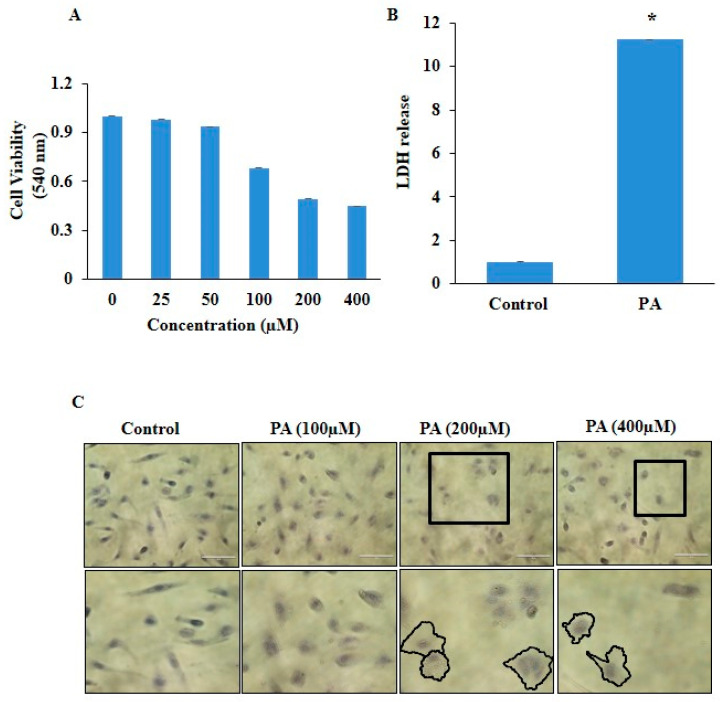
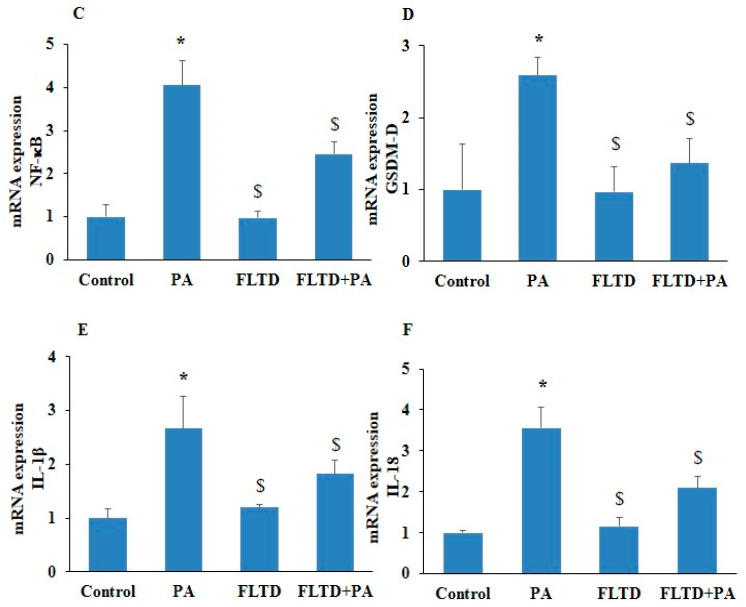
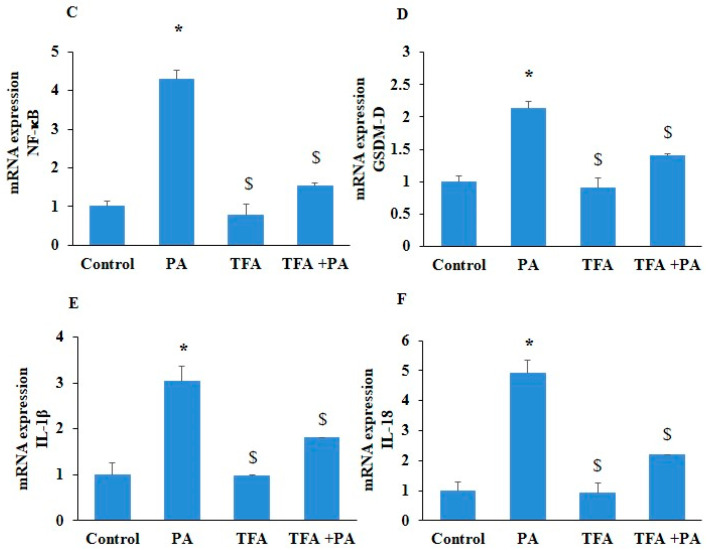
Background: Pyroptosis, an inflammatory cell death, is involved in the progression of atherosclerosis. Pyroptosis in endothelial cells (ECs) and its underlying mechanisms in atherosclerosis are poorly understood. Here, we investigated the role of a caspase-4/5-NF-κB pathway in pyroptosis in palmitic acid (PA)-stimulated ECs and EVs as players in pyroptosis. Methods: Human umbilical vein endothelial cells (HUVECs) were cultured in an endothelial cell medium, treated with Ox-LDL, PA, caspase-4/5 inhibitor, NF-κB inhibitor, and sEV release inhibitor for 24 h, respectively. The cytotoxicity of PA was determined using an MTT assay, cell migration using a scratch-wound-healing assay, cell morphology using bright field microscopy, and lipid deposition using oil red O staining. The mRNA and protein expression of GSDM-D, CASP4, CASP5, NF-κB, NLRP3, IL-1β, and IL-18 were determined with RT-PCR and Western blot. Immunofluorescence was used to determine NLRP3 and ICAM-1 expressions. Extracellular vesicles (EVs) were isolated using an exosome isolation kit and were characterized by Western blot and scanning electron microscopy. Results: PA stimulation significantly changed the morphology of the HUVECs characterized by cell swelling, plasma membrane rupture, and increased LDH release, which are features of pyroptosis. PA significantly increased lipid accumulation and reduced cell migration. PA also triggered inflammation and endothelial dysfunction, as evidenced by NLRP3 activation, upregulation of ICAM-1 (endothelial activation marker), and pyroptotic markers (NLRP3, GSDM-D, IL-1β, IL-18). Inhibition of caspase-4/5 (Ac-FLTD-CMK) and NF-κB (trifluoroacetate salt (TFA)) resulted in a significant reduction in LDH release and expression of caspase-4/5, NF-κB, and gasdermin D (GSDM-D) in PA-treated HUVECs. Furthermore, GW4869, an exosome release inhibitor, markedly reduced LDH release in PA-stimulated HUVECs. EVs derived from PA-treated HUVECs exacerbated pyroptosis, as indicated by significantly increased LDH release and augmented expression of GSDM-D, NF-κB. Conclusions: The present study revealed that inflammatory, non-canonical caspase-4/5-NF-κB signaling may be one of the crucial mechanistic pathways associated with pyroptosis in ECs, and pyroptotic EVs facilitated pyroptosis in normal ECs during atherosclerosis.

Keywords: atherosclerosis; cytokines; endothelial cells; endothelial dysfunction; inflammasome; inflammation; pyroptosis.


Conflict of interest statement

The authors declare no conflicts of interest.

Figures

Figure 1
Figure 1
Cell viability and pyroptosis in palmitate-stimulated HUVECs. (A) Dose-dependent effect of PA on HUVECs viability compared to untreated control cells by the MTT assay. (B) The cellular supernatant LDH level was evaluated with a cytotoxicity detection LDH kit. (C) Representative images of HUVECs after their treatment with different concentrations of PA for 24 h. Hematoxylin was used for nuclear staining, and nuclei appear blue. Pyroptotic cells are indicated with square icon and marked structures in second panel indicates blubbed membrane and a swollen structure (Scale bar, 100 μm). n = 3. Results are presented as mean ± standard deviation. * p < 0.05 vs. the control group.
Figure 2
Figure 2
Effect of palmitic acid on cell migration and lipotoxicity in HUVECs. (A) The wound-healing assay was performed in the presence of BSA or PA (200 μM) for 24 h (Scale bar: 500 nm) n = 3. (B) Summarized bar graph showed quantification of cell migration. (C) Cells were stained with the oil red O stain, and lipid accumulation was visualized under a microscope after 24 h treatment. Second panel is enlarged portion of square icons in the first panel, and indicates the cells with lipid deposition. Scale bar (100 μm). (D) Quantification of the stained lipid droplets was performed using the eluted oil red O stain by measuring absorbance at 495 nm. n = 3. Results are presented as mean ± standard deviation. * p < 0.05 vs. the control group, $ < 0.05 vs. the PA group, # < 0.05 vs. the Ox-LDL group.
Figure 2
Figure 2
Effect of palmitic acid on cell migration and lipotoxicity in HUVECs. (A) The wound-healing assay was performed in the presence of BSA or PA (200 μM) for 24 h (Scale bar: 500 nm) n = 3. (B) Summarized bar graph showed quantification of cell migration. (C) Cells were stained with the oil red O stain, and lipid accumulation was visualized under a microscope after 24 h treatment. Second panel is enlarged portion of square icons in the first panel, and indicates the cells with lipid deposition. Scale bar (100 μm). (D) Quantification of the stained lipid droplets was performed using the eluted oil red O stain by measuring absorbance at 495 nm. n = 3. Results are presented as mean ± standard deviation. * p < 0.05 vs. the control group, $ < 0.05 vs. the PA group, # < 0.05 vs. the Ox-LDL group.
Figure 3
Figure 3
Effect of palmitic acid on inflammatory caspases and pyroptotic markers. Summarized bar graphs showed mRNA expression of (A) caspase-4, (B) caspase-5, (C) IL-1β, (D) IL-18, and (E) GSDM-D determined by RT-PCR. GAPDH was used as internal control. n = 4–5. Results are presented as mean ± standard deviation. * p < 0.05 vs. control group.
Figure 4
Figure 4
Effect of palmitic acid on endothelial dysfunction. Representative photomicrographs depicted (A) NLRP3 (green) and (B) ICAM-1 (red) (Scale bar, 100 μm). Summarized bar graph showed mRNA expression of (C) NLRP3 and (D) ICAM-1 determined by RT-PCR. n = 3. GAPDH was used as internal control. Results are presented as mean ± standard deviation. * p < 0.05 vs. control group.
Figure 4
Figure 4
Effect of palmitic acid on endothelial dysfunction. Representative photomicrographs depicted (A) NLRP3 (green) and (B) ICAM-1 (red) (Scale bar, 100 μm). Summarized bar graph showed mRNA expression of (C) NLRP3 and (D) ICAM-1 determined by RT-PCR. n = 3. GAPDH was used as internal control. Results are presented as mean ± standard deviation. * p < 0.05 vs. control group.
Figure 5
Figure 5
Inhibition of non-canonical caspase-4/5 blocked mRNA expression of pyroptotic pathway markers in PA-induced HUVECs. HUVECs were pre-incubated with caspase-4/5 inhibitor AC-FLTD-CMK (10 µm/mL) for 2 h, then exposed to PA (200 µm) for 24 h. Summarized bar graph showed mRNA expression of (A) caspase-4, (B) caspase-5, (C) NF-κB, (D) GSDM-D, (E) IL-1β, and (F) IL-18, determined via RT-PCR. n = 3. GAPDH was used as internal control. n = 3–4. Results are presented as mean ± standard deviation. * p < 0.05 vs. control group, $ < 0.05 vs. PA group.
Figure 5
Figure 5
Inhibition of non-canonical caspase-4/5 blocked mRNA expression of pyroptotic pathway markers in PA-induced HUVECs. HUVECs were pre-incubated with caspase-4/5 inhibitor AC-FLTD-CMK (10 µm/mL) for 2 h, then exposed to PA (200 µm) for 24 h. Summarized bar graph showed mRNA expression of (A) caspase-4, (B) caspase-5, (C) NF-κB, (D) GSDM-D, (E) IL-1β, and (F) IL-18, determined via RT-PCR. n = 3. GAPDH was used as internal control. n = 3–4. Results are presented as mean ± standard deviation. * p < 0.05 vs. control group, $ < 0.05 vs. PA group.
Figure 6
Figure 6
Inhibition of non-canonical caspase-4/5 blocked protein levels of pyroptotic pathway markers in PA-induced HUVECs. HUVECs were pre-incubated with caspase-4/5 inhibitor, AC-FLTD-CMK (10 µm/mL) for 2 h, then exposed to PA (200 µm) for 24 h. (A) Lactate dehydrogenase release (LDH). (B) Representative Western blot analysis showing the effects of caspase-4/5 inhibition on caspase-4, caspase-5, GSDM-D, and NF-κB protein expression. Summarized data showed the changes in the protein expression of (C) caspase-4, (D) caspase-5, (E) NF-κB, and (F) GSDM-D. β-actin was used as an internal control. n = 3–4. Results are presented as mean ± standard deviation. * p < 0.05 vs. the control group, $ < 0.05 vs. the PA group.
Figure 6
Figure 6
Inhibition of non-canonical caspase-4/5 blocked protein levels of pyroptotic pathway markers in PA-induced HUVECs. HUVECs were pre-incubated with caspase-4/5 inhibitor, AC-FLTD-CMK (10 µm/mL) for 2 h, then exposed to PA (200 µm) for 24 h. (A) Lactate dehydrogenase release (LDH). (B) Representative Western blot analysis showing the effects of caspase-4/5 inhibition on caspase-4, caspase-5, GSDM-D, and NF-κB protein expression. Summarized data showed the changes in the protein expression of (C) caspase-4, (D) caspase-5, (E) NF-κB, and (F) GSDM-D. β-actin was used as an internal control. n = 3–4. Results are presented as mean ± standard deviation. * p < 0.05 vs. the control group, $ < 0.05 vs. the PA group.
Figure 7
Figure 7
Inhibition of NF-κB blocked mRNA expression of pyroptotic pathway markers in PA-induced HUVECs. HUVECs were pre-incubated with NF-κB inhibitor, trifluoroacetate (TFA) (20 µm/mL) for 2 h, and then exposed to PA (200 µm) for 24 h. Summarized bar graph showed mRNA expression for (A) caspase-4, (B) caspase-5, (C) NF-κB, (D) GSDM-D, (E) IL-1β, and (F) IL-18, determined via RT-PCR. GAPDH was used as internal control. n = 3. Results are presented as mean ± standard deviation. * p < 0.05 vs. control group, $ < 0.05 vs. PA group.
Figure 7
Figure 7
Inhibition of NF-κB blocked mRNA expression of pyroptotic pathway markers in PA-induced HUVECs. HUVECs were pre-incubated with NF-κB inhibitor, trifluoroacetate (TFA) (20 µm/mL) for 2 h, and then exposed to PA (200 µm) for 24 h. Summarized bar graph showed mRNA expression for (A) caspase-4, (B) caspase-5, (C) NF-κB, (D) GSDM-D, (E) IL-1β, and (F) IL-18, determined via RT-PCR. GAPDH was used as internal control. n = 3. Results are presented as mean ± standard deviation. * p < 0.05 vs. control group, $ < 0.05 vs. PA group.
Figure 8
Figure 8
Inhibition of NF-κB blocked protein levels of pyroptotic pathway markers in PA-induced HUVECs. HUVECs were pre-incubated with NF-κB inhibitor, trifluoroacetate (TFA) (20 µm/mL) for 2 h, and then exposed to PA (200 µm) for 24 h. (A) Lactate dehydrogenase (LDH) release. (B) Representative Western blot analysis showing the effects of NF-κB inhibition on caspase-4, caspase-5, GSDM-D, and NF-κB protein expression. Summarized data show the changes in the protein expression of (C) caspase-4, (D) caspase-5, (E) NF-κB, and (F) GSDM-D. β-actin was used as internal control. n = 3. Results are presented as mean ± standard deviation. * p < 0.05 vs. control group, $ < 0.05 vs. PA group.
Figure 8
Figure 8
Inhibition of NF-κB blocked protein levels of pyroptotic pathway markers in PA-induced HUVECs. HUVECs were pre-incubated with NF-κB inhibitor, trifluoroacetate (TFA) (20 µm/mL) for 2 h, and then exposed to PA (200 µm) for 24 h. (A) Lactate dehydrogenase (LDH) release. (B) Representative Western blot analysis showing the effects of NF-κB inhibition on caspase-4, caspase-5, GSDM-D, and NF-κB protein expression. Summarized data show the changes in the protein expression of (C) caspase-4, (D) caspase-5, (E) NF-κB, and (F) GSDM-D. β-actin was used as internal control. n = 3. Results are presented as mean ± standard deviation. * p < 0.05 vs. control group, $ < 0.05 vs. PA group.
Figure 9
Figure 9
Characterization of small extracellular vesicles/exosomes and their role in pyroptosis in PA-induced HUVECs. (A) Representative scanning electron micrographs of sEVs/exosomes isolated from culture medium of HUVECs (Scale bar, 100 nm). (B) Representative Western blot analysis of different exosomal protein markers (Alix TSG 101) and cell lysate proteins (Calnexin and β-Actin) collected from HUVECs. (C) LDH release was measured in HUVECs, pre-incubated with exosome release inhibitor (GW4869) (5 µm/mL) for 2 h, and then exposed to PA (200 µm) for 24 h. (D) HUVECs were co-cultured with EVs isolated from PA-induced HUVECs, and lactate dehydrogenase release (LDH) was measured. (E) Representative Western blot analysis showing effects of EVs isolated from PA-induced HUVECs on GSDM-D and NF-κB protein expression. Summarized data showed changes in protein expression of (F) GSDM-D and (G) NF-κB. n = 3. Results are presented as mean ± standard deviation. Data from two groups were analyzed using two-tailed Student’s t-test. * p < 0.05 vs. control group, $ < 0.05 vs. PA group.

Similar articles

Cited by

References

    1. He B., Nie Q., Wang F., Han Y., Yang B., Sun M., Fan X., Ye Z., Liu P., Wen J. Role of pyroptosis in atherosclerosis and its therapeutic implications. J. Cell. Physiol. 2021;236:7159–7175. doi: 10.1002/jcp.30366. - DOI - PubMed
    1. Gao W., Wang X., Zhou Y., Wang X., Yu Y. Autophagy, ferroptosis, pyroptosis, and necroptosis in tumor immunotherapy. Signal Transduct. Target. Ther. 2022;7:196. doi: 10.1038/s41392-022-01046-3. - DOI - PMC - PubMed
    1. Wu X., Zhang H., Qi W., Zhang Y., Li J., Li Z., Lin Y., Bai X., Liu X., Chen X., et al. Nicotine promotes atherosclerosis via ROS-NLRP3-mediated endothelial cell pyroptosis. Cell Death Dis. 2018;9:171. doi: 10.1038/s41419-017-0257-3. - DOI - PMC - PubMed
    1. Liu W., Yin Y., Zhou Z., He M., Dai Y. OxLDL-induced IL-1β secretion promoting foam cells formation was mainly via CD36 mediated ROS production leading to NLRP3 inflammasome activation. Inflamm. Res. 2014;63:33–43. doi: 10.1007/s00011-013-0667-3. - DOI - PubMed
    1. Duewell P., Kono H., Rayner K.J., Sirois C.M., Vladimer G., Bauernfeind F.G., Abela G.S., Franchi L., Nunez G., Schnurr M., et al. NLRP3 inflammasomes are required for atherogenesis and activated by cholesterol crystals. Nature. 2010;464:1357–1361. doi: 10.1038/nature08938. - DOI - PMC - PubMed

LinkOut - more resources