. 2024 Nov 22;17(12):1570.
doi: 10.3390/ph17121570.

Modelling of Cetylpyridinium Chloride Availability in Complex Mixtures for the Prediction of Anti-Microbial Activity Using Diffusion Ordered Spectroscopy, Saturation Transfer Difference and 1D NMR

Affiliations

Modelling of Cetylpyridinium Chloride Availability in Complex Mixtures for the Prediction of Anti-Microbial Activity Using Diffusion Ordered Spectroscopy, Saturation Transfer Difference and 1D NMR

Cameron Robertson et al. Pharmaceuticals (Basel). .

Abstract

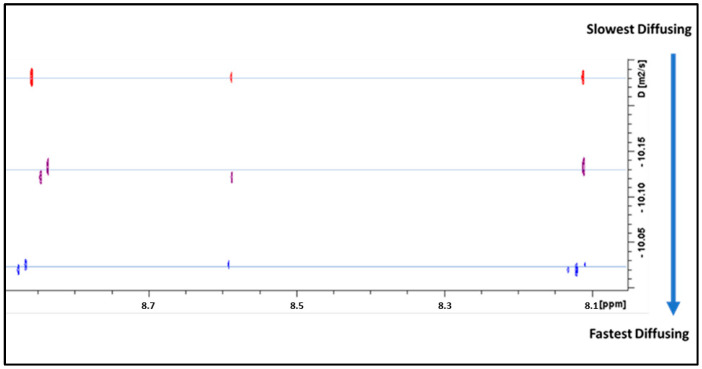
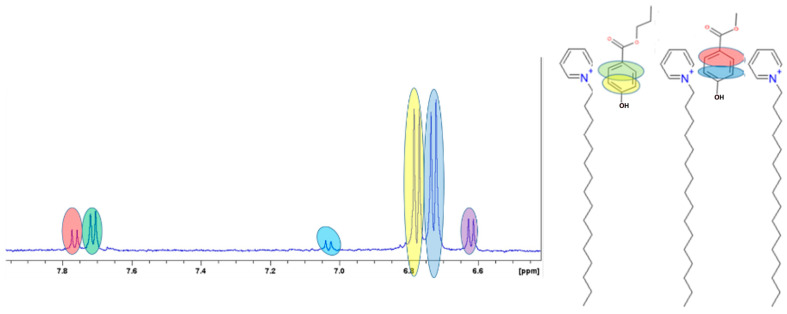
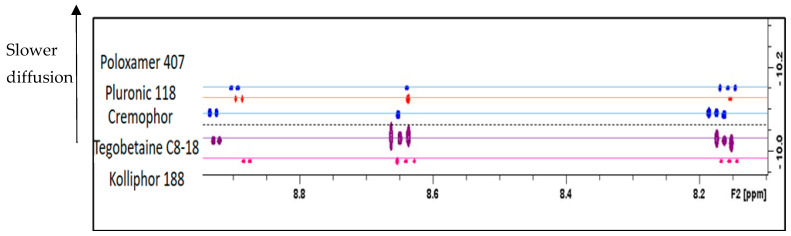
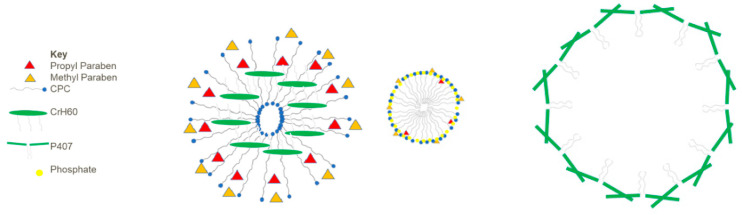
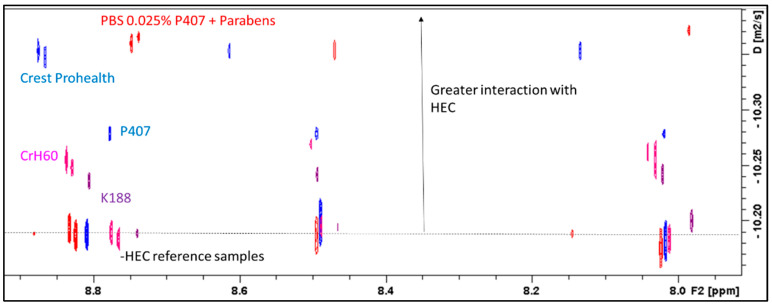
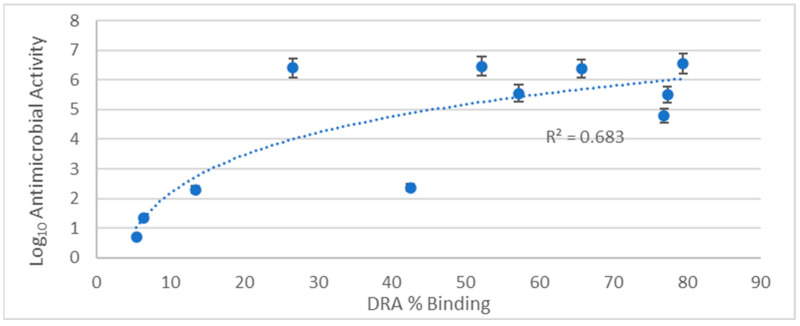
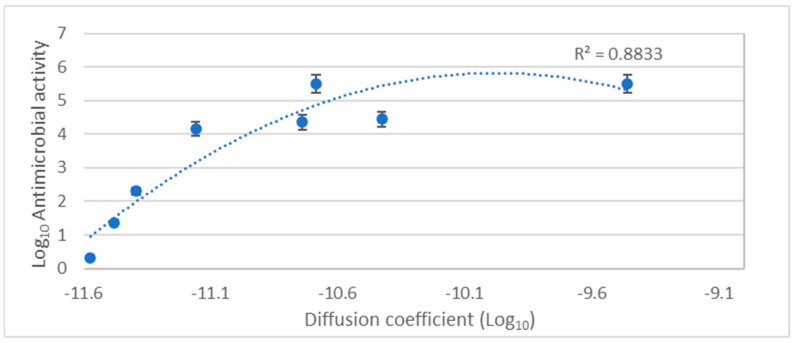
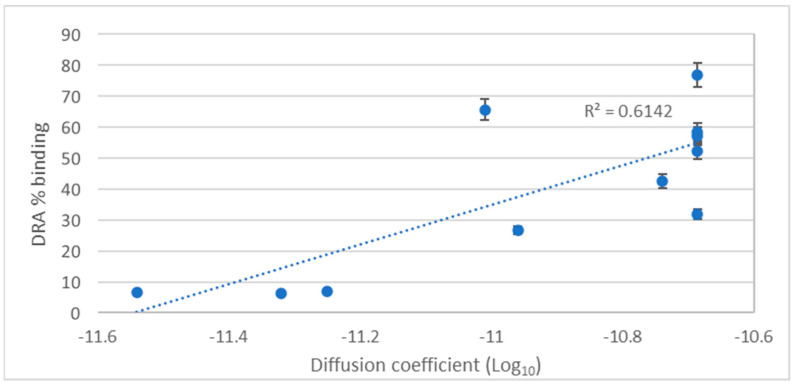
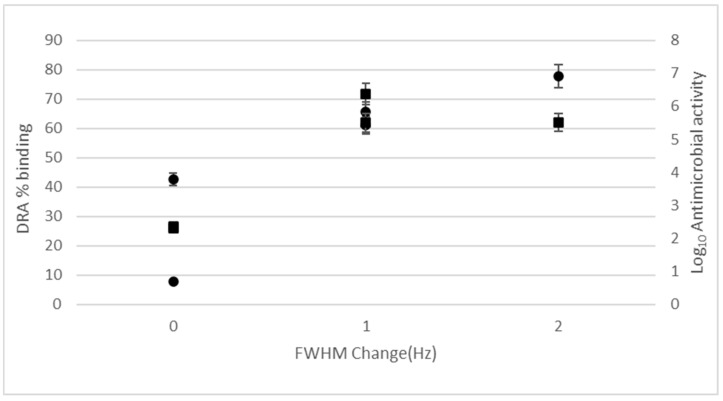
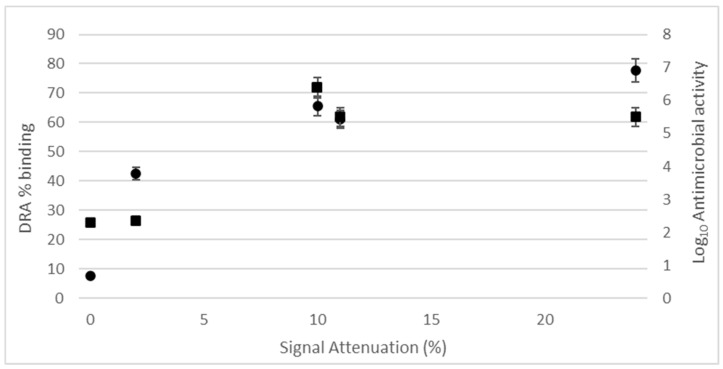
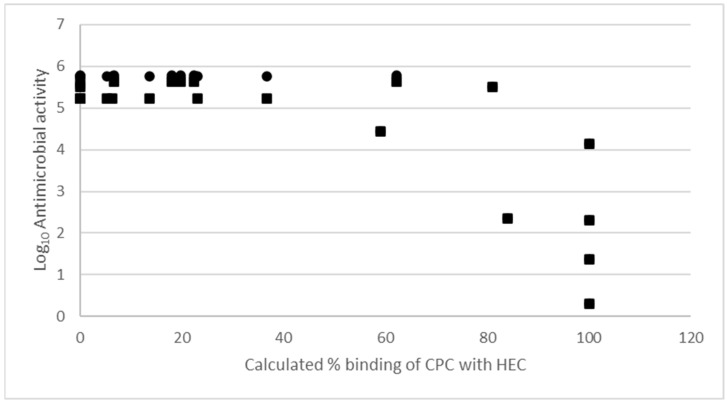
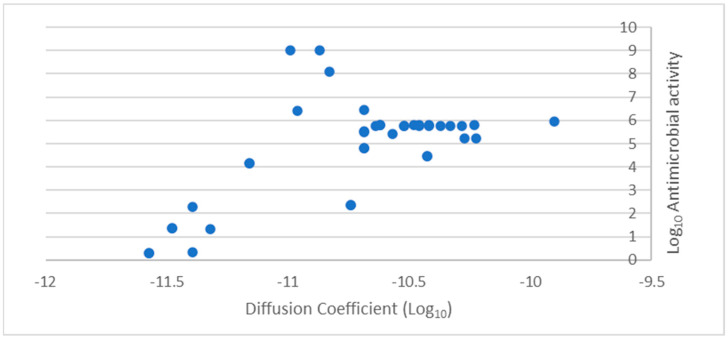
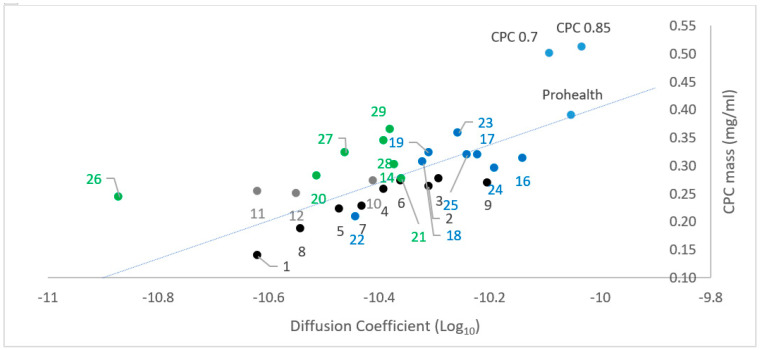
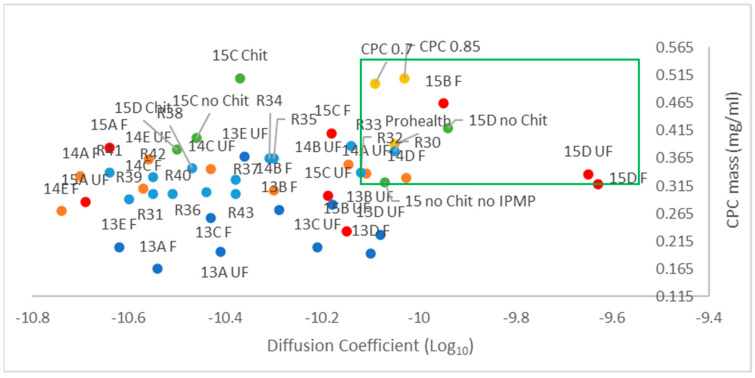
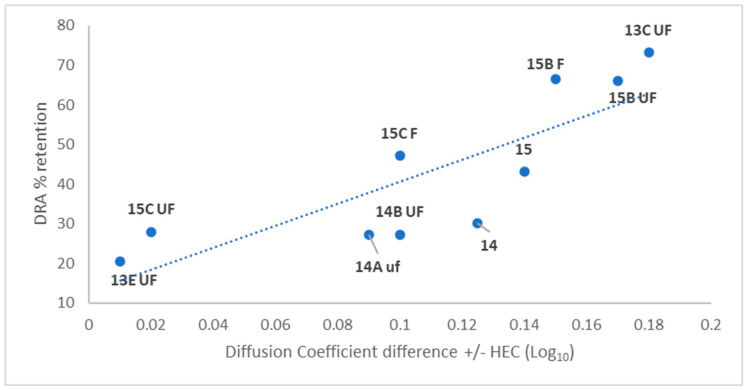
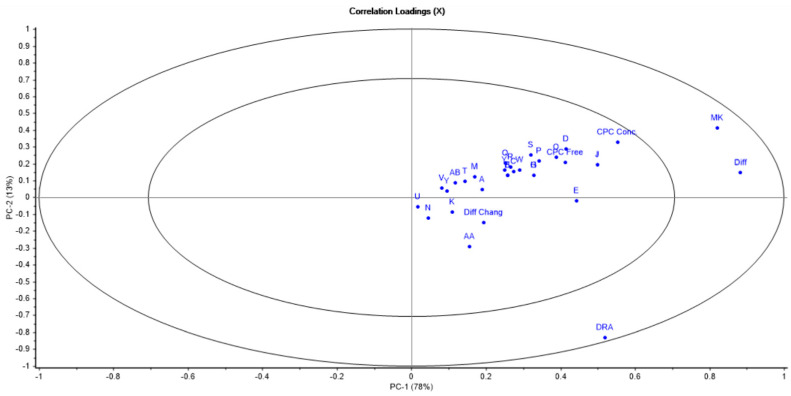
Background/Objectives: A range of NMR techniques, including diffusion ordered spectroscopy (DOSY) were used to characterise complex micelles formed by the anti-microbial cationic surfactant cetylpyridium chloride and to quantify the degree of interaction between cetylpyridium chloride and hydroxyethyl cellulose in a variety of commercially relevant formulations as a model for the disk retention assay. Methods: This NMR-derived binding information was then compared with the results of formulation analysis by traditional disk retention assay (DRA) and anti-microbial activity assays to assess the suitability of these NMR techniques for the rapid identification of formulation components that could augment or retard antimicrobial activity DRA. Results: NMR showed a strong ability to predict anti-microbial activity for a diverse range of formulations containing cetylpyridinium chloride (CPC). Conclusions: This demonstrates the value of this NMR-based approach as a rapid, relatively non-destructive method for screening commercial experimental anti-microbial formulations for efficacy and further helps to understand the interplay of excipients and active ingredients.

Keywords: NMR; anti-microbial; cetylpyridinium chloride; diffusion; formulation; micelles.


Conflict of interest statement

Author Sayoni Batabyal, Darren Whitworth, Angharad Smith, Alessandra Montesanto, and Robert Lucas were employed by the company Haleon. The remaining authors declare that the research was conducted in the absence of any commercial or financial relationships that could be construed as a potential conflict of interest. Tomris and Cameron were funded by Haleon, but analysis and evaluation was carried out independent of Haleon PLC.

Figures

Figure 1
Figure 1
DOSY NMR spectrum (chemical shift versus Log10 of diffusion coefficient (m2s−1) for 0.07% w/w CPC in the presence of (top) P407 block copolymer (3 mg/mL), (middle) methyl parabens (0.5 mg/mL) and P407 block copolymer (1 mg/mL), (bottom) P407 block copolymer (1 mg/mL)). Diffusion was referenced to TPS as the internal standard.
Figure 2
Figure 2
(Left) STD NMR difference spectrum (x-axis chemical shift (ppm) spectrum with downfield (8 ppm) signals for both parabens significantly less attenuated compared with the upfield signals (7.5 ppm) for the same molecules representing greater saturation transfer). (Right) Representation of the relative orientation of the parabens with respect to the CPC monomers forming a micelle as hypothesised from STD data. The different colours correlate to the proton environments, which are assigned. Blue and purple residual signals are from anethole.
Figure 3
Figure 3
DOSY NMR (chemical shift versus log of diffusion coefficient (m2s−1) of CPC aromatic signals for different block copolymers). CPC/MP/PP (2 mM) and block copolymer (5 mg/mL). This shows the combined effects of parabens and block copolymer types on average CPC micelle size.
Figure 4
Figure 4
Simplistic cartoon representations of the interactions between CPC and block copolymer. (left) Formation of mixed Cremophor and parabens/CPC liposome and (middle) the formation of discrete CPC micelles in the presence of phosphate/lower parabens concentrations and (right) isolated P407 block copolymer as determined by NMR techniques described previously.
Figure 5
Figure 5
2D 1H DOSY NMR, illustrating the impact that the block copolymer has on the interaction of the CPC (aromatic signals only) with HEC. The bottom line shows the CPC diffusion for reference samples prior to HEC addition.
Figure 6
Figure 6
Log10 antimicrobial activity of E. coli vs. DRA result as % binding.
Figure 7
Figure 7
(Top) Diffusion coefficient from DOSY NMR for CPC aromatic signals vs. Log10 antimicrobial activity against E. coli—polynomial trendline. (Bottom) DRA % binding score vs. diffusion coefficient from DOSY NMR for CPC. These full formulations have been anonymised in the graphs.
Figure 7
Figure 7
(Top) Diffusion coefficient from DOSY NMR for CPC aromatic signals vs. Log10 antimicrobial activity against E. coli—polynomial trendline. (Bottom) DRA % binding score vs. diffusion coefficient from DOSY NMR for CPC. These full formulations have been anonymised in the graphs.
Figure 8
Figure 8
(Top) DRA (●) and antimicrobial activity (■) vs. change in full width at half maximum (FWHM) after addition of HEC (10 mg/mL). (Bottom) DRA (●) and antimicrobial activity (■) vs. signal attenuation after addition of HEC (10 mg/mL).
Figure 8
Figure 8
(Top) DRA (●) and antimicrobial activity (■) vs. change in full width at half maximum (FWHM) after addition of HEC (10 mg/mL). (Bottom) DRA (●) and antimicrobial activity (■) vs. signal attenuation after addition of HEC (10 mg/mL).
Figure 9
Figure 9
Experimental formulations calculated binding (Equation (3)) of CPC with HEC vs. antimicrobial activity. (■) S. mutans (●) E. coli. Formulations detailed in Table S1a.
Figure 10
Figure 10
Clustering of Log10 antimicrobial activity (E. coli) vs. diffusion parameter for CPC. This combines Table S1a–c.
Figure 11
Figure 11
qNMR determined concentration of CPC vs. diffusion coefficient for CPC. Full formulation from Section 3.2 used as a point of reference (Table S1b). The different colour groupings indicate different batches as per Table S1a–d.
Figure 12
Figure 12
qNMR determined concentration of CPC vs. diffusion coefficient for CPC for wider range of experimental formulations, with green box to indicate the “ideal” zone for CPC. This combines data from Table S1a–d. The different colour groupings indicate different batches as per Table S1a–d.
Figure 13
Figure 13
DRA vs. diffusion coefficient change (Log10) for HEC-adsorbed CPC signals for wider range of experimental formulations. Taken from Table S1c. UF indicates an unflavoured version of the same numbered formulation.
Figure 14
Figure 14
PCA loading plot for 114 experimental formulations. See Table 1 (Section 3.8) for legend.
Scheme 1
Scheme 1
Method for M10 kill time test for antimicrobial activity for E. coli.

Similar articles

References

    1. De Werner C.W.A., Seymour R.A. Are Alcohol-Containing Mouthwashes Safe? Br. Dent. J. 2009;207:522. doi: 10.1038/sj.bdj.2009.1014. - DOI - PubMed
    1. Wei F., Mortimer M., Cheng H., Sang N., Guo L.-H. Parabens as chemicals of emerging concern in the environment and humans: A review. Sci. Total. Environ. 2021;778:146150. doi: 10.1016/j.scitotenv.2021.146150. - DOI - PubMed
    1. Yap A. Oral Health Equals Total Health: A Brief Review. J. Dent. Indones. 2017;24:59–62. doi: 10.14693/jdi.v24i2.1122. - DOI
    1. Meurman J., Bascones-Martinez A. Oral Infections and Systemic Health: More than Just Links to Cardiovascular Diseases. Oral Health Prev. Dent. 2021;19:441–448. doi: 10.3290/j.ohpd.b1993965. - DOI - PMC - PubMed
    1. Iva S., Maria C., John D. The Impact of Oral Health on Overall Wellness. J. Clin. Dent. 2009;20:55–61. - PubMed

Grants and funding

LinkOut - more resources