

Identification of a Potential PGK1 Inhibitor with the Suppression of Breast Cancer Cells Using Virtual Screening and Molecular Docking
- PMID: 39770478
- PMCID: PMC11676932
- DOI: 10.3390/ph17121636
Identification of a Potential PGK1 Inhibitor with the Suppression of Breast Cancer Cells Using Virtual Screening and Molecular Docking
Abstract
Background/objectives: Breast cancer is the second most common malignancy worldwide and poses a significant threat to women's health. However, the prognostic biomarkers and therapeutic targets of breast cancer are unclear. A prognostic model can help in identifying biomarkers and targets for breast cancer. In this study, a novel prognostic model was developed to optimize treatment, improve clinical prognosis, and screen potential phosphoglycerate kinase 1 (PGK1) inhibitors for breast cancer treatment.
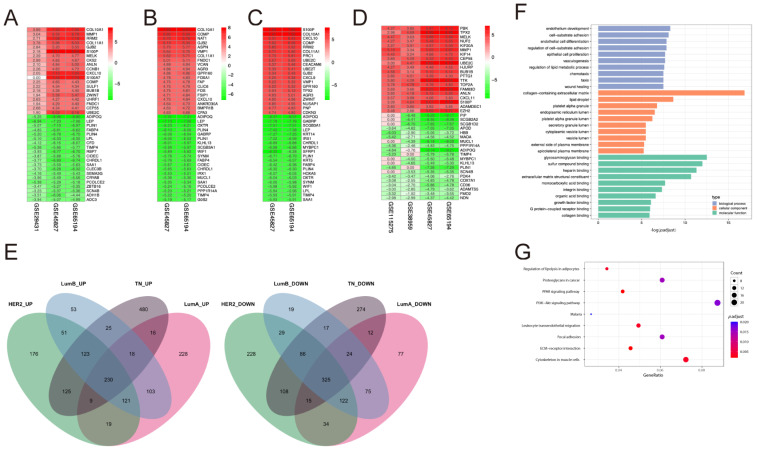
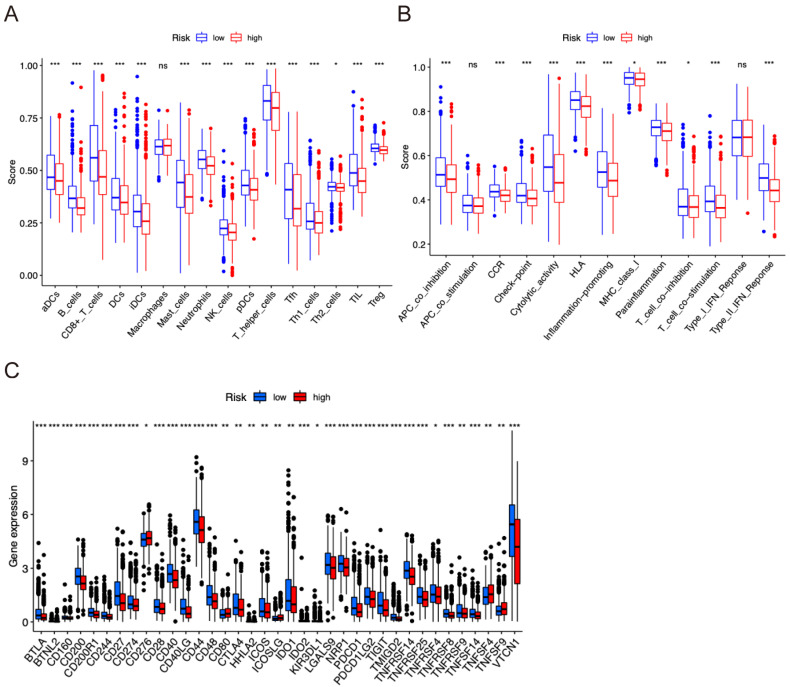
Methods: Using data from the Gene Expression Omnibus (GEO) database, differentially expressed genes (DEGs) were identified in normal individuals and breast cancer patients. The biological functions of the DEGs were examined using bioinformatics analysis. A novel prognostic model was then constructed using the DEGs through LASSO and multivariate Cox regression analyses. The relationship between the prognostic model, survival, and immunity was also evaluated. In addition, virtual screening was conducted based on the risk genes to identify novel small molecule inhibitors of PGK1 from Chemdiv and Targetmol libraries. The effects of the potential inhibitors were confirmed through cell experiments.
Results: A total of 230 up- and 325 down-regulated DEGs were identified in HER2, LumA, LumB, and TN breast cancer subtypes. A new prognostic model was constructed using ten risk genes. The analysis from The Cancer Genome Atlas (TCGA) indicated that the prognosis was poorer in the high-risk group compared to the low-risk group. The accuracy of the model was confirmed using the ROC curve. Furthermore, functional enrichment analyses indicated that the DEGs between low- and high-risk groups were linked to the immune response. The risk score was also correlated with tumor immune infiltrates. Moreover, four compounds with the highest score and the lowest affinity energy were identified. Notably, D231-0058 showed better inhibitory activity against breast cancer cells.
Conclusions: Ten genes (ACSS2, C2CD2, CXCL9, KRT15, MRPL13, NR3C2, PGK1, PIGR, RBP4, and SORBS1) were identified as prognostic signatures for breast cancer. Additionally, results showed that D231-0058 (2-((((4-(2-methyl-1H-indol-3-yl)-1,3-thiazol-2-yl)carbamoyl)methyl)sulfanyl)acetic acid) may be a novel candidate for treating breast cancer.
Keywords: breast cancer; phosphoglycerate kinase 1 (PGK1); prognostic model; virtual screening.
Conflict of interest statement
The authors declare no conflicts of interest.
Figures


Similar articles
-
Validating linalool as a potential drug for breast cancer treatment based on machine learning and molecular docking.Drug Dev Res. 2024 Jun;85(4):e22223. doi: 10.1002/ddr.22223. Drug Dev Res. 2024. PMID: 38879780
-
Identification of cuproptosis-related subtypes, construction of a prognosis model, and tumor microenvironment landscape in gastric cancer.Front Immunol. 2022 Nov 21;13:1056932. doi: 10.3389/fimmu.2022.1056932. eCollection 2022. Front Immunol. 2022. PMID: 36479114 Free PMC article.
-
Identification of prognostic gene signature associated with microenvironment of lung adenocarcinoma.PeerJ. 2019 Nov 29;7:e8128. doi: 10.7717/peerj.8128. eCollection 2019. PeerJ. 2019. PMID: 31803536 Free PMC article.
-
Construction of mRNA prognosis signature associated with differentially expressed genes in early stage of stomach adenocarcinomas based on TCGA and GEO datasets.Eur J Med Res. 2022 Oct 17;27(1):205. doi: 10.1186/s40001-022-00827-4. Eur J Med Res. 2022. PMID: 36253873 Free PMC article.
-
Construction of a novel mRNA-signature prediction model for prognosis of bladder cancer based on a statistical analysis.BMC Cancer. 2021 Jul 27;21(1):858. doi: 10.1186/s12885-021-08611-z. BMC Cancer. 2021. PMID: 34315402 Free PMC article.
Cited by
-
Management, Safety, and Efficacy Evaluation of Nutraceutical and Functional Food: A Global Perspective.Compr Rev Food Sci Food Saf. 2025 Jul;24(4):e70222. doi: 10.1111/1541-4337.70222. Compr Rev Food Sci Food Saf. 2025. PMID: 40613254 Free PMC article. Review.
References
Grants and funding
- 82225047, 32170274/National Natural Science Foundation of China
- 2022YFC3501700/National Key Research and Development Program of China
- XBTK-2021006/Collaborative Grant-in-Aid of the HBUT National "111" Center for Cellular Regulation and Molecular Pharmaceutics
- 202105FE02/Open Project Funding of the Key Laboratory of Fermentation Engineering (Ministry of Education)
- 2024AH051675/Natural Science Research Project of Anhui Educational Committee
LinkOut - more resources
Full Text Sources
Research Materials
Miscellaneous
