

Delayed Sowing Reduced Verticillium Wilt by Altering Soil Temperature and Humidity to Enhance Beneficial Rhizosphere Bacteria of Sunflower
- PMID: 39770619
- PMCID: PMC11676687
- DOI: 10.3390/microorganisms12122416
Delayed Sowing Reduced Verticillium Wilt by Altering Soil Temperature and Humidity to Enhance Beneficial Rhizosphere Bacteria of Sunflower
Abstract
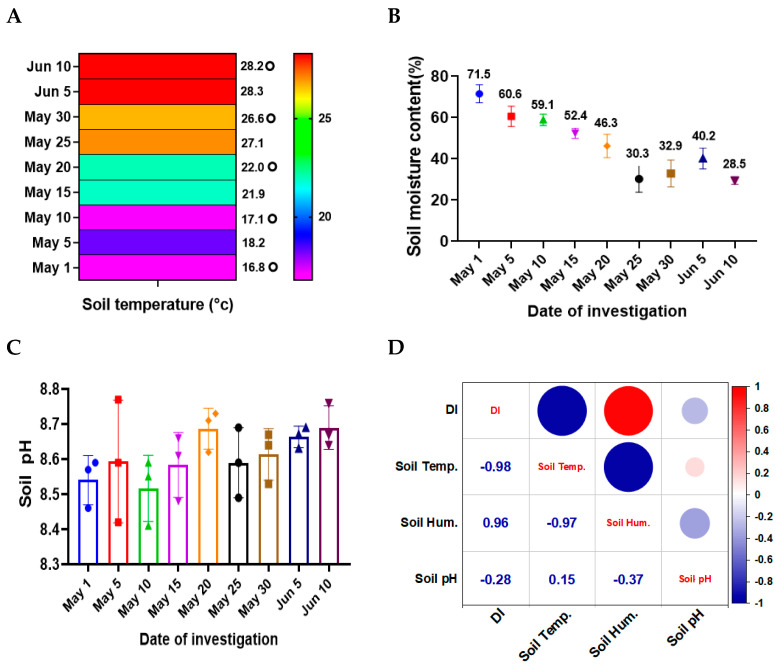
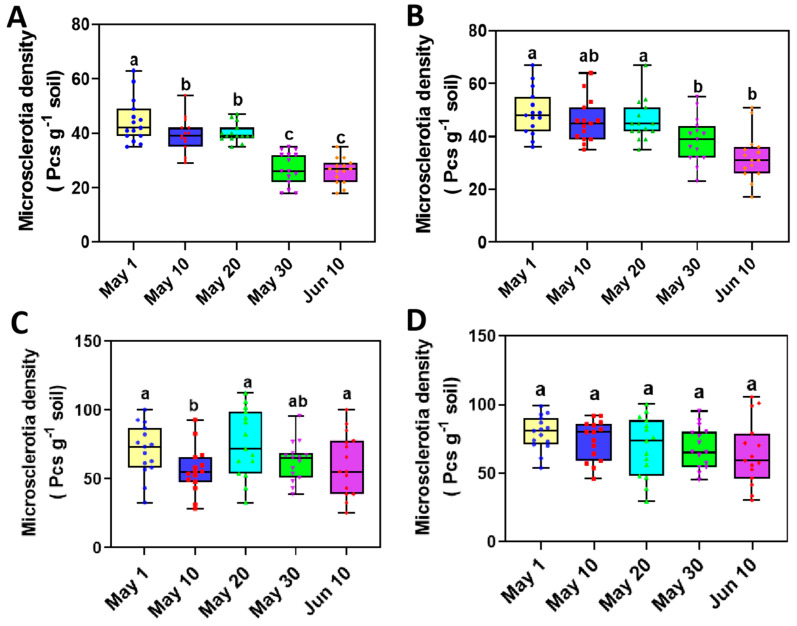
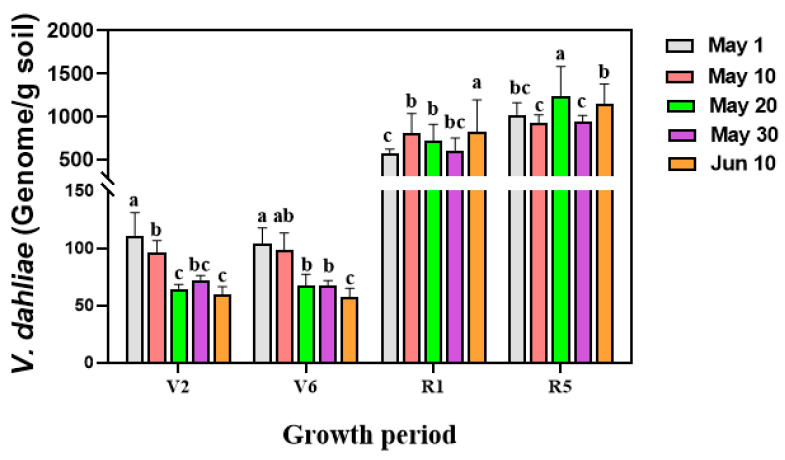
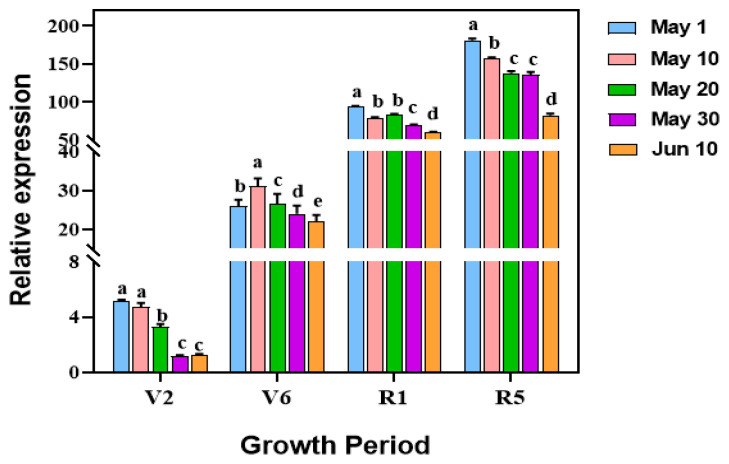
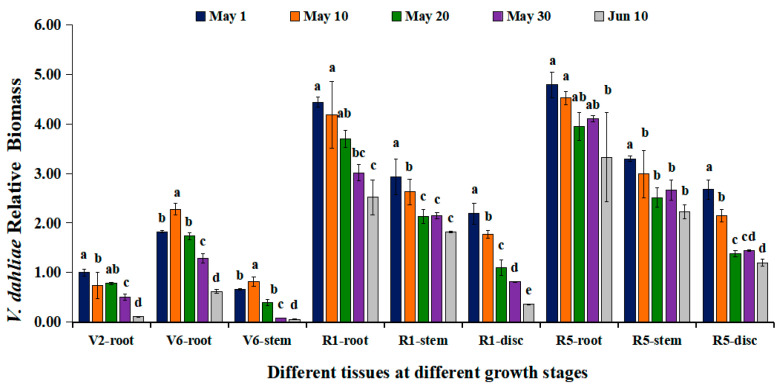
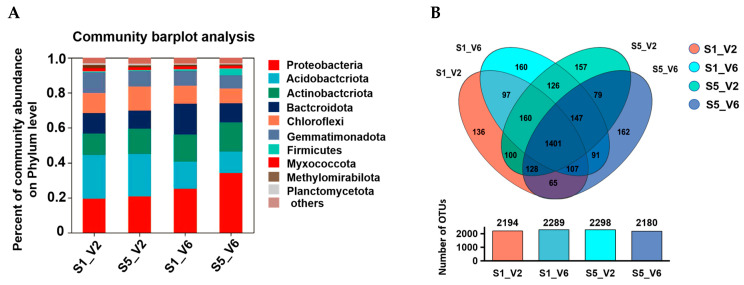
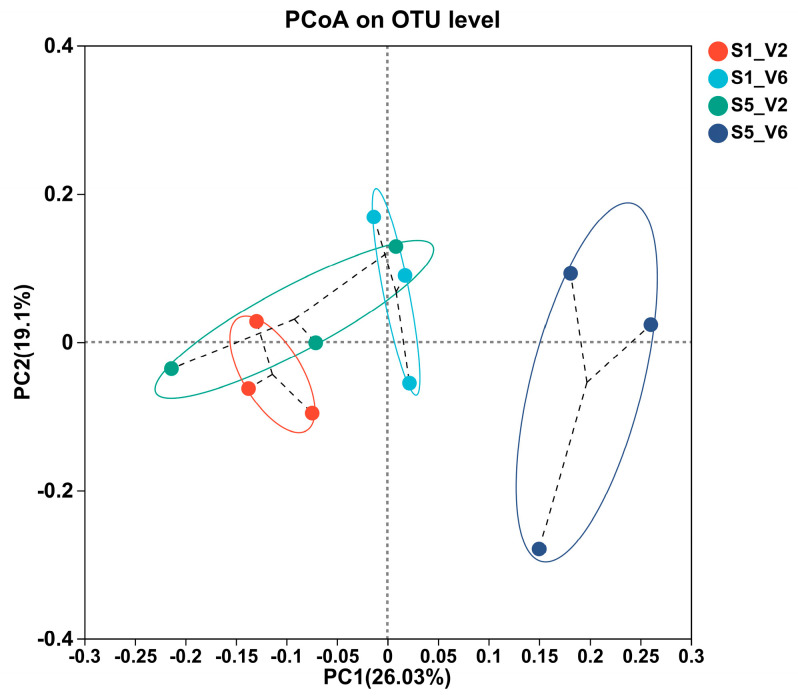
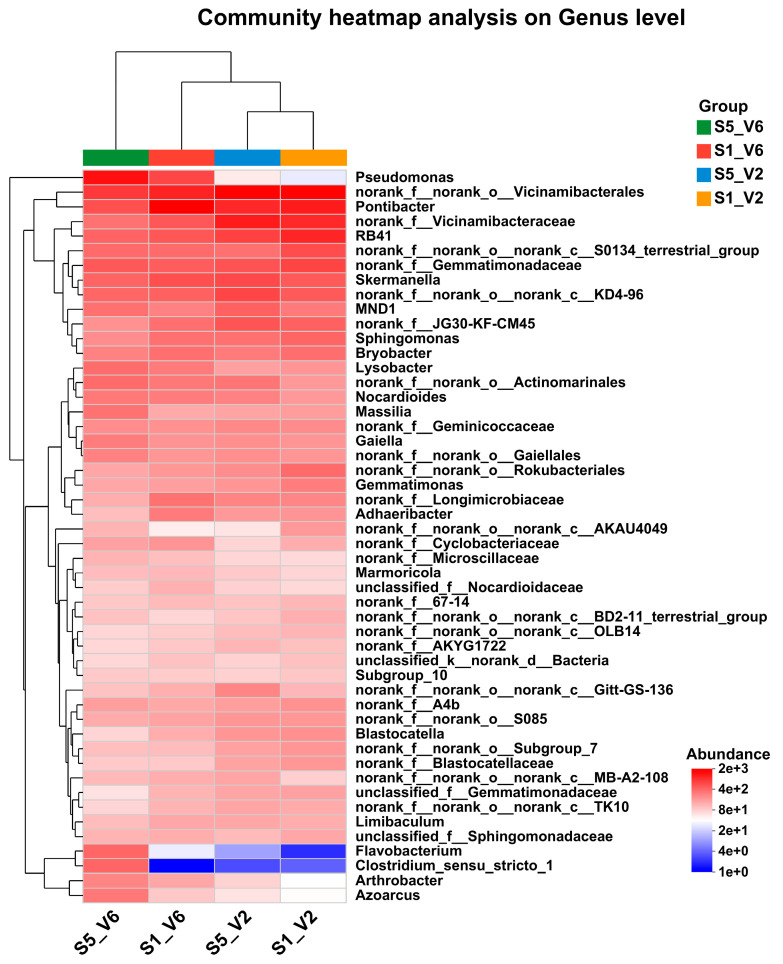
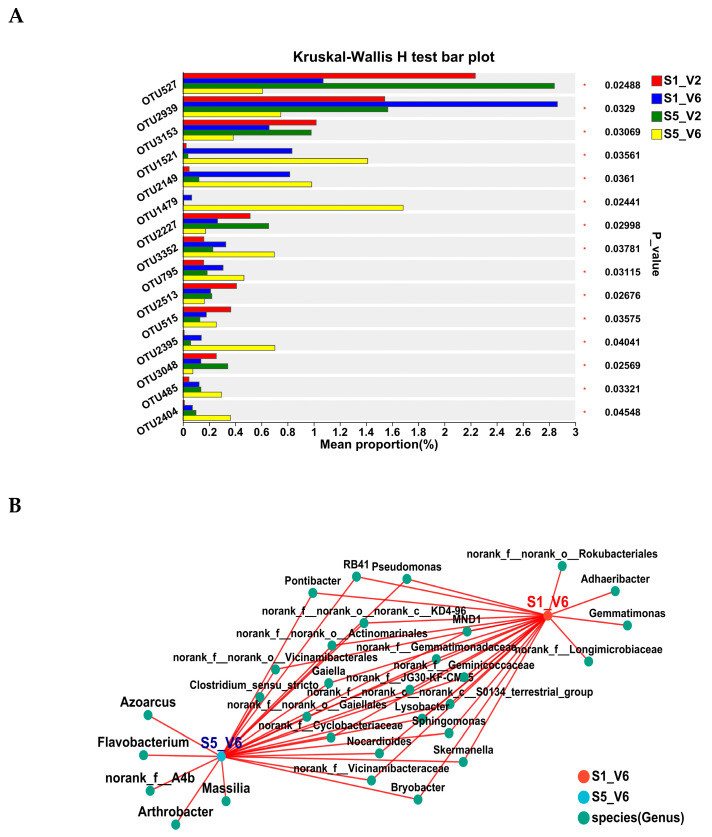
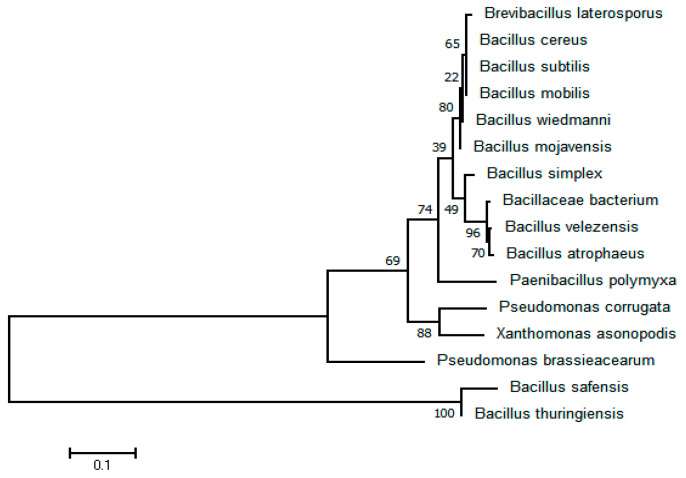
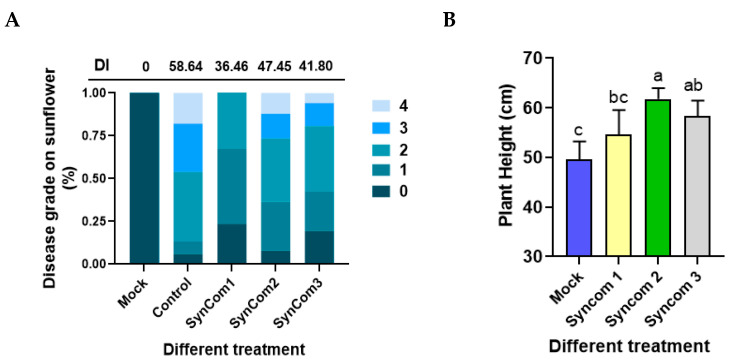
Sunflower Verticillium Wilt (SVW) caused by Verticillium dahliae is a significant threat to sunflower production in China. This soilborne disease is difficult to control. It has been observed that delayed sowing reduces the severity of SVW on different varieties and across various locations. Soil was collected from multiple locations with different sowing dates to understand the underlying biological mechanisms driving this phenomenon. The soil bacterial community was characterized through 16S rRNA gene amplicon sequencing performed on the Illumina MiSeq platform, followed by comprehensive bioinformatics analysis. Microsclerotia numbers in soil were detected using both NP-10 selective medium and quantitative polymerase chain reaction (qPCR). By delaying the sowing date, the number of microsclerotia in soil and the biomass of V. dahliae colonized inside sunflower roots were reduced during the early developmental stages (V2-V6) of sunflowers. Amplicon sequencing revealed an increased abundance of bacterial genera, such as Pseudomonas, Azoarcus, and Bacillus in soil samples collected from delayed sowing plots. Five bacterial strains isolated from the delayed sowing plot exhibited strong antagonistic effects against V. dahliae. The result of the pot experiments indicated that supplying two different synthetic communities (SynComs) in the pot did increase the control efficiencies on SVW by 19.08% and 37.82% separately. Additionally, soil temperature and humidity across different sowing dates were also monitored, and a significant correlation between disease severity and environmental factors was observed. In conclusion, delayed sowing appears to decrease microsclerotia levels by recruiting beneficial rhizosphere bacteria, thereby reducing the severity of SVW.
Keywords: SynComs; antagonistic effect; disease severity; sowing date.
Conflict of interest statement
The authors declare no conflicts of interest.
Figures
Similar articles
-
Green Fluorescent Protein-Tagged Bacillus axarquiensis TUBP1 Reduced Cotton Verticillium Wilt Incidence by Altering Soil Rhizosphere Microbial Communities.Curr Microbiol. 2021 Sep;78(9):3562-3576. doi: 10.1007/s00284-021-02618-2. Epub 2021 Aug 4. Curr Microbiol. 2021. PMID: 34347145
-
Rhizosphere-associated soil microbiome variability in Verticillium wilt-affected Cotinus coggygria.Front Microbiol. 2024 Jan 5;14:1279096. doi: 10.3389/fmicb.2023.1279096. eCollection 2023. Front Microbiol. 2024. PMID: 38249458 Free PMC article.
-
Relationships Between Verticillium dahliae Inoculum Density and Wilt Incidence, Severity, and Growth of Cauliflower.Phytopathology. 1998 Oct;88(10):1108-15. doi: 10.1094/PHYTO.1998.88.10.1108. Phytopathology. 1998. PMID: 18944824
-
Cultivar-Dependent Variation of the Cotton Rhizosphere and Endosphere Microbiome Under Field Conditions.Front Plant Sci. 2019 Dec 20;10:1659. doi: 10.3389/fpls.2019.01659. eCollection 2019. Front Plant Sci. 2019. PMID: 31921274 Free PMC article.
-
Interactions between Verticillium dahliae and cotton: pathogenic mechanism and cotton resistance mechanism to Verticillium wilt.Front Plant Sci. 2023 Apr 21;14:1174281. doi: 10.3389/fpls.2023.1174281. eCollection 2023. Front Plant Sci. 2023. PMID: 37152175 Free PMC article. Review.
References
-
- Green R.J. Soil factors affecting the survival of microsclerotia of Verticillium dahliae. Phytopathology. 1980;70:353–355. doi: 10.1094/Phyto-70-353. - DOI
-
- Bell A.A. Verticillium wilt. In: Hillocks R.J., editor. Cotton Diseases. CAB International; Wallingford, UK: 1992. pp. 87–126.
-
- Mol L. Effect of plant roots on the germination of microsclerotia of Verticillium dahliae. II. Quantitative analysis of the luring effects of crops. Eur. J. Plant Pathol. 1955;101:673–678. doi: 10.1007/BF01874871. - DOI
-
- Gerik J.S., Huisman O.C. Study of field-grown cotton roots infected with Verticillium dahliae using an immuno enzymatic staining technique. Phytopathology. 1988;78:1174–1178. doi: 10.1094/Phyto-78-1174. - DOI
-
- Zhang W.W., Jiang T.F., Cui X., Qi F.J., Jian G.L. Colonization in cotton plants by a green fluorescent protein labeled strain of Verticillium dahliae. Eur. J. Plant Pathol. 2013;135:867–876. doi: 10.1007/s10658-012-0131-1. - DOI
Grants and funding
- NMGIRT2320/Program for Innovative Research Teams in Universities of Inner Mongolia Autonomous Region
- CARS-14/the China Agricultural Research System
- BR22-13-09/the Basic Research Funds of Inner Mongolia Agricultural University
- CARS-IMAR-4-1-03/the earmarked fund
- 2022ZY0075/the Central Government Guide to Local Science and Technology Development Fund
LinkOut - more resources
Full Text Sources
Miscellaneous
