. 2024 Dec 20;12(12):2650.
doi: 10.3390/microorganisms12122650.

Innovative Methodology for Antimicrobial Susceptibility Determination in Mycoplasma Biofilms

Affiliations

Innovative Methodology for Antimicrobial Susceptibility Determination in Mycoplasma Biofilms

B Tegner Jacobson et al. Microorganisms. .

Abstract

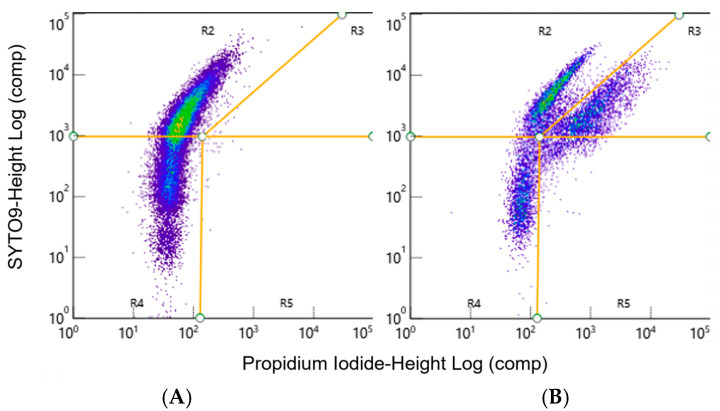
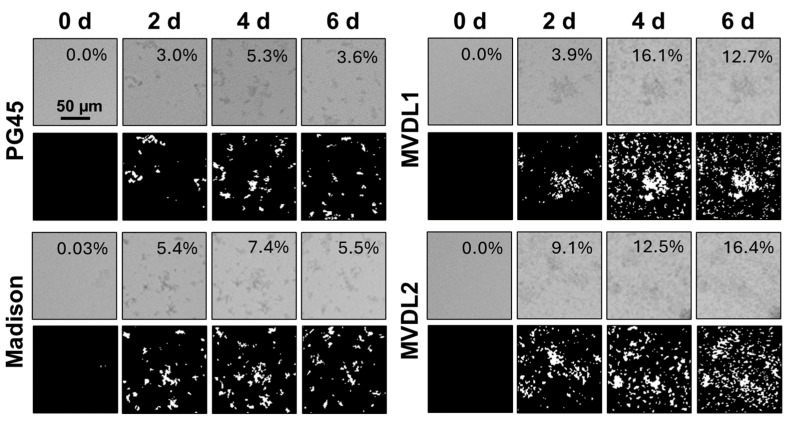
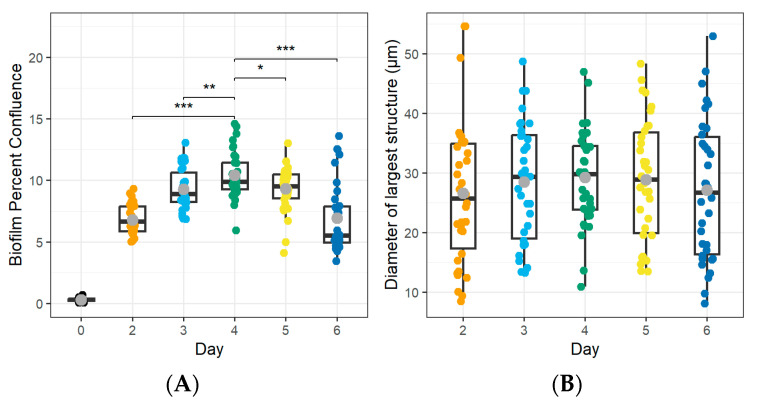
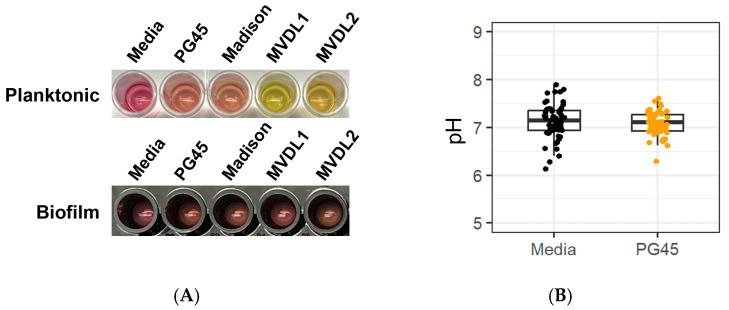
Mycoplasma spp. are facultative pathogens that contribute to the pathogenesis of multiple bovine diseases, including the bovine respiratory disease complex, and have been shown to form biofilms. Biofilm formation is associated with increased antibiotic resistance in many organisms, but accurate determination of antimicrobial susceptibility in biofilms is challenging. In Mycoplasma spp., antimicrobial susceptibility is routinely determined using metabolic pH-dependent color change. However, biofilm formation can lead to reduced metabolism, making interpretation of metabolic readouts difficult. Therefore, we developed and optimized a new flow cytometry-based method for antimicrobial susceptibility testing in biofilm-forming Mycoplasma, termed the live/dead antimicrobial susceptibility test (LD-AST). The LD-AST measures the proportion of live bacteria upon exposure to antibiotics, works robustly with both planktonic and biofilm cultures, and enables the determination of the minimum bactericidal concentration (MBC) for a given antibiotic. We used two strains of Mycoplasma bovis (Donetta PG45 and Madison) and two clinical Mycoplasma bovoculi isolates (MVDL1 and MVDL2) to determine the impact of biofilm growth on antimicrobial susceptibility for gentamicin, enrofloxacin, or tetracycline. All Mycoplasma strains were susceptible to all antibiotics when cultured as planktonic cells, with MBCs in the expected range. However, three out of four strains (Donetta PG45, MVDL1, and MVDL2) were completely resistant to all three antibiotics when newly adhered biofilms were analyzed, whereas M. bovis Madison gave variable results. For mature biofilms that were cultured for 4-5 days before antibiotic exposure, results also were variable, with some strains showing an increased resistance with certain antibiotics and a decreased resistance with others. Overall, these results are consistent with earlier reports that biofilms can exhibit increased antimicrobial resistance.

Keywords: Mycoplasma bovis; Mycoplasma sp.; antimicrobial resistance; assay development; biofilm formation; flow cytometry; live/dead staining.


Conflict of interest statement

The authors declare no conflicts of interest.

Figures

Figure 1
Figure 1
Representative FACS dot plots of live and dead M. bovis samples. The live/dead stain was visualized as the log intensity of SYTO9 versus the log intensity of the PI (A) Live cells were gated as SYTO9-positive, PI-negative cells in gate R2. (B) TritonX-100 treatment was used to kill a proportion of the M. bovis to create a positive control. Dead cells are found as SYTO9-positive, PI-positive cells in gate R3. Representative data from one experiment.
Figure 2
Figure 2
Brightfield images of Mycoplasma biofilm formation on glass-bottom plates over 6 d. Top rows: phase contrast images; bottom rows: thresholded images used to estimate the percent confluence of the biofilm in the field of view. Data are representative of one experiment with 18 technical replicates.
Figure 3
Figure 3
Maturation of M. bovis PG45 biofilms over time. Biofilm maturity was assessed based on the percent confluence of the cells and the largest structure diameter observed. (A) Biofilm confluence peaked at 4 d, which showed strong evidence of a difference (Wald’s Test, p < 0.01) compared to all other days post-inoculation. (B) The diameter of the largest biofilm structure did not vary across the different days (Wald’s test, p > 0.05). The boxplot displays the median and quartiles of the population, the grey point indicates the mean. Representative of two experiments, each with 16–18 technical replicates. * p < 0.05, ** p < 0.01, *** p < 0.001.
Figure 4
Figure 4
Standard color change assay is inappropriate for measuring Mycoplasma spp. biofilm growth. (A) A color change due to acid production is visible for planktonic cells (top, grown for 2 d on a clear polystyrene plate), but not for mature biofilms (bottom, incubated with new media for 2 d after biofilm formation on a glass-bottom plate with black polystyrene wells). (B) Quantification of medium pH for M. bovis PG45 grown as a biofilm for 6 d. No significant difference in pH between the media control and PG45 (Student’s t-test, p > 0.05). Representative of one experiment with 60 technical replicates.
Figure 5
Figure 5
Impact of biofilm disruption treatment on M. bovis particle size. Particle size of disrupted M. bovis biofilms was determined using SYTO9 stained cells with an imaging cytometer. (A) Two populations for the planktonic cells were noted, with a natural division observed at 1.75 × 10⁵ RFU, which corresponds with a particle diameter of approximately 5 µm. (B) For the disrupted biofilms, the 10 min sonication had strong evidence (Wald’s test, p = 0.015) for an increase in small particles compared to the untreated biofilms The percentage of particles above and below 5 µm was calculated for each treatment and compared. Representative of one experiment with two replicate cultures, each with two technical replicates (represented by different colored lines). Each technical replicate had ~5 × 10⁴–8 × 10⁴ particles/biofilm replicate and ~8 × 10³–16 × 103 particles/planktonic replicate.
Figure 6
Figure 6
Impact of 10 min of sonication on the particle size of M. bovis PG45 biofilms. The particle size of disrupted biofilms was further analyzed by observing the forward scatter from a 405 nm small particle laser and comparing it to size calibration beads. (A) Planktonic M. bovis PG45 culture. (B) Untreated M. bovis PG45 biofilm. (C) M. bovis PG45 biofilm after 10 min sonication. Representative graphs were generated by randomly selecting and concatenating 1 × 10⁶ particles from each technical replicate. Representative of one experiment with 4 technical replicates.
Figure 7
Figure 7
Impact of 10 min of sonication on the mean fluorescence of the M. bovis PG45 particles. There was a 9.37 ± 0.57% decrease (Wald’s Test, p < 0.001) in mean particle size between the untreated biofilm and the 10 min sonicated biofilm. The point is the estimated mean and the 95% confidence interval from the separate means model. Representative of one experiment with four technical replicates.
Figure 8
Figure 8
Analysis of cell viability and density for the LD-AST. (A) The survival of filtered cells exposed to 10 min of sonication and the rate of cell adherence was assessed. Filtered planktonic cells were sonicated for 10 min to determine if the treatment would lead to a decrease in live cells. The imaging and flow cytometry results were compared. Representative of one experiment with six technical replicates. (B) Cells inoculated at 2 × 10⁴/mL were imaged at 1, 2.5, and 4 h intervals to determine the rate of adhesion to the glass-bottom plate. The line represents the inoculum concentration while the shaded area represents the 103–105 cells/mL target range. Representative of one experiment with three technical replicates.
Figure 9
Figure 9
The LD-AST reveals increased MBCs for M. bovis PG45 biofilms compared to planktonic bacteria. Minimum bactericidal concentration of a decrease in live cells ≥ 5% (MBC ≥ 5%) data showing the percentage of live cells compared to (A) enrofloxacin, (B) gentamicin, and (C) tetracycline concentrations for each of the organism states. The colored boxes correspond to the lowest antibiotic concentration that resulted in a significant drop in the percentage of live cells. The mean and SEM are shown for each group. Representative of three independent experiments with 2 technical replicates.

Similar articles

References

    1. White B.J., Larson B.L. Impact of bovine respiratory disease in U.S. beef cattle. Anim. Health Res. Rev. 2020;21:132–134. doi: 10.1017/S1466252320000079. - DOI - PubMed
    1. Cusack P. Evaluation of practices used to reduce the incidence of bovine respiratory disease in Australian feedlots (to November 2021) Aust. Vet. J. 2023;101:230–247. doi: 10.1111/avj.13239. - DOI - PubMed
    1. Punyapornwithaya V., Fox L.K., Hancock D.D., Gay J.M., Alldredge J.R. Association between an outbreak strain causing mycoplasma bovis mastitis and its asymptomatic carriage in the herd: A case study from Idaho, USA. Prev. Vet. Med. 2010;93:66–70. doi: 10.1016/j.prevetmed.2009.08.008. - DOI - PubMed
    1. Wilson D.J., Skirpstunas R.T., Trujillo J.D., Cavender K.B., Bagley C.V., Harding R.L. Unusual history and initial clinical signs of Mycoplasma bovis mastitis and arthritis in first-lactation cows in a closed commercial dairy herd. J. Am. Vet. Med. Assoc. 2007;230:1519–1523. doi: 10.2460/javma.230.10.1519. - DOI - PubMed
    1. Dudek K., Bednarek D., Lisiecka U., Kycko A., Reichert M., Kostro K., Winiarczyk S. Analysis of the Leukocyte Response in Calves Suffered from Mycoplasma bovis Pneumonia. Pathogens. 2020;9:407. doi: 10.3390/pathogens9050407. - DOI - PMC - PubMed

LinkOut - more resources