. 2024 Dec 21;12(12):2657.
doi: 10.3390/microorganisms12122657.

Proline Improves Pullulan Biosynthesis Under High Sugar Stress Condition

Affiliations

Proline Improves Pullulan Biosynthesis Under High Sugar Stress Condition

Keyi Liu et al. Microorganisms. .

Abstract

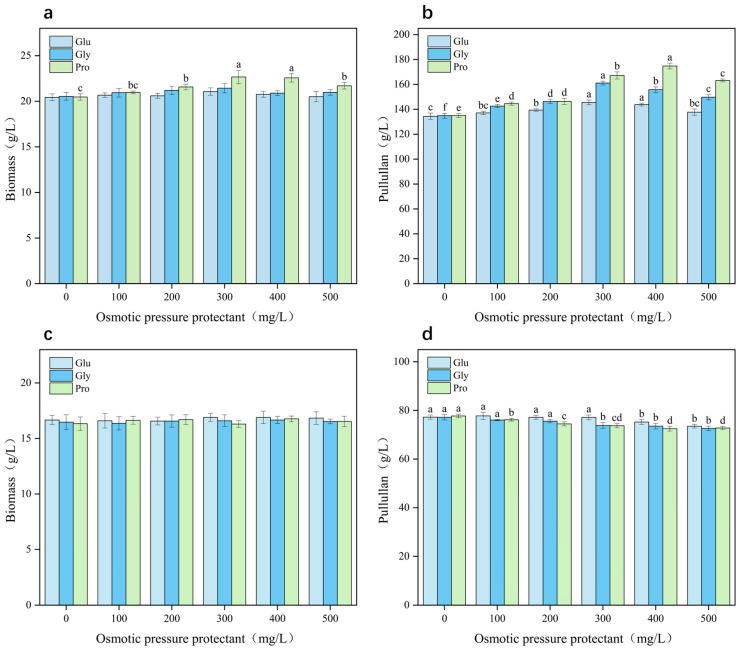
Pullulan is an extracellular polysaccharide produced via the fermentation of Aureobasidium pullulans. However, high sugar concentrations and hyperosmotic stress limit pullulan biosynthesis during the fermentation process. Therefore, we investigated the effects of proline supplementation on A. pullulans growth and pullulan biosynthesis under high sugar and hyperosmotic stress using physiological, biochemical, and transcriptomic analyses. High sugar concentrations significantly inhibited A. pullulans growth and pullulan biosynthesis. High sugar and hyperosmotic stress conditions significantly increased intracellular proline content in A. pullulans. However, treatment with proline (400 mg/L proline) significantly increased biomass and pullulan yield by 10.75% and 30.06% (174.8 g/L), respectively, compared with those in the control group. To further investigate the effect of proline on the fermentation process, we performed scanning electron microscopy and examined the activities of key fermentation enzymes. Proline treatment preserved cell integrity and upregulated the activities of key enzymes involved in pullulan biosynthesis. Transcriptome analysis revealed that most differentially expressed genes in the proline group were associated with metabolic pathways, including glycolysis/gluconeogenesis, pyruvate metabolism, and sulfur metabolism. Conclusively, proline supplementation protects A. pullulans against high sugar and hyperosmotic stress, providing a new theoretical basis and strategy for the efficient industrial production of pullulans.

Keywords: Aureobasidium pullulans; RNA sequencing; hyperglycemia; hypertonicity; proline; pullulan.


Conflict of interest statement

Authors Feng Li and Zhenxing Zhang were employed by the company Shandong Shendong Intelligent Equipment Co., Ltd. Author Qingming Zeng was employed by the company Shandong Mimei Biological Technology Co., Ltd. The remaining authors declare that the research was conducted in the absence of any commercial or financial relationships that could be construed as a potential conflict of interest.

Figures

Figure 1
Figure 1
Effect of different sugar concentrations on pullulan production and Aureobasidium pullulans growth: Pullulan yield (a); cell biomass (b).
Figure 2
Figure 2
Changes in the contents of glutamic acid, glycine, and proline under different sucrose concentrations were evaluated. Significant differences (p < 0.05) were determined using a one-way analysis of variance with Duncan’s test and represented using different letters.
Figure 3
Figure 3
Effects of exogenous supplementation of glutamic acid, glycine, and proline on biomass (a) and pullulan yield (b) under high sugar conditions (200 g/L) and on biomass (c) and pullulan yield (d) under low sugar conditions (100 g/L). Significant differences (p < 0.05) were determined using a one-way analysis of variance with Duncan’s test and represented using different letters.
Figure 4
Figure 4
Effect of exogenous proline on proline (a) and glycerol (b) concentration in Aureobasidium pullulans cells at different sucrose concentrations (100 and 200 g/L).
Figure 5
Figure 5
Comparative analysis of scanning electron microscopy images of the experimental and control groups in the absence of proline: (a) Control cells, magnification: 10,000×. (b) Control cells, magnification: 2500×. (c) Cells in the experimental group, magnification: 10,000×. (d) Cells in the experimental group, magnification: 2500×.
Figure 6
Figure 6
Activities of pullulan biosynthetic and degrading enzymes in the experimental and control groups in the presence or absence of proline at different fermentation stages. UGP: UDP–glucose pyrophosphorylase (a); PGM: α-phosphoglucomutase (b); UGT: UDP–glucosyltransferase (c); AMY: α-amylase (d); IPU: isopullulanase (e). Asterisks indicate the level of significance using the Student’s t-test (* p  <  0.05; ** p  <  0.01) in comparison to the control without proline addition.
Figure 7
Figure 7
Sample correlation heat map (a). Statistics of differentially expressed genes (DEGs) (b). Volcano plot (c) and heatmap (d) showing gene expression patterns in the control (CK) and proline (CP) groups. CK: Aureobasidium pullulans cultivated for 24 h in the initial fermentation medium; CP: A. pullulans cultivated for 24 h in the fermentation medium containing proline. In the volcano plot of differential genes, each point represents a gene, with red representing upregulation and blue representing downregulation. In the differential comparison clustering heat map, the expression levels of genes in different samples are represented by different colors.
Figure 8
Figure 8
Gene ontology (GO) enrichment circle diagram (a): The first circle represents the top 20 enriched GO terms, the second circle represents the number and Q value of the GO term in the background of differential genes, and the third circle represents the proportion of upregulated and downregulated DEGs. GO enrichment difference bubble chart (b): The ordinate is -log10 (Q value), and the abscissa is the z-score value. GO enrichment classification histogram (c): abscissa is the secondary GO term, ordinate is the number of differential genes in the term, and different colors represent different types of GO terms.
Figure 8
Figure 8
Gene ontology (GO) enrichment circle diagram (a): The first circle represents the top 20 enriched GO terms, the second circle represents the number and Q value of the GO term in the background of differential genes, and the third circle represents the proportion of upregulated and downregulated DEGs. GO enrichment difference bubble chart (b): The ordinate is -log10 (Q value), and the abscissa is the z-score value. GO enrichment classification histogram (c): abscissa is the secondary GO term, ordinate is the number of differential genes in the term, and different colors represent different types of GO terms.
Figure 9
Figure 9
Kyoto Encyclopedia of Genes and Genomes (KEGG) enrichment circle diagram (a): The first circle represents the top 20 enriched pathways, the second circle represents the number and Q value of the pathway, and the third circle represents the proportion of upregulated and downregulated DEGs. KEGG enrichment difference bubble chart (b): The ordinate is −log10 (Q value), and the abscissa is the z-score value. KEGG enrichment secondary classification histogram (c): the top 20 KEGG enriched pathways.
Figure 9
Figure 9
Kyoto Encyclopedia of Genes and Genomes (KEGG) enrichment circle diagram (a): The first circle represents the top 20 enriched pathways, the second circle represents the number and Q value of the pathway, and the third circle represents the proportion of upregulated and downregulated DEGs. KEGG enrichment difference bubble chart (b): The ordinate is −log10 (Q value), and the abscissa is the z-score value. KEGG enrichment secondary classification histogram (c): the top 20 KEGG enriched pathways.

Similar articles

References

    1. Farris S., Unalan I.U., Introzzi L., Fuentes-Alventosa J.M., Cozzolino C.A. Pullulan-based films and coatings for food packaging: Present applications, emerging opportunities, and future challenges. J. Appl. Polym. Sci. 2014;131:40539. doi: 10.1002/app.40539. - DOI
    1. Singh R.S., Kaur N., Kennedy J.F. Pullulan production from agro-industrial waste and its applications in food industry: A review. Carbohydr. Polym. 2019;217:46–57. doi: 10.1016/j.carbpol.2019.04.050. - DOI - PubMed
    1. Cheng K.-C., Demirci A., Catchmark J.M. Pullulan: Biosynthesis, production, and applications. Appl. Microbiol. Biotechnol. 2011;92:29–44. doi: 10.1007/s00253-011-3477-y. - DOI - PubMed
    1. Prajapati V.D., Jani G.K., Khanda S.M. Pullulan: An exopolysaccharide and its various applications. Carbohydr. Polym. 2013;95:540–549. doi: 10.1016/j.carbpol.2013.02.082. - DOI - PubMed
    1. Sugumaran K.R., Ponnusami V.J.C.P. Review on production, downstream processing and characterization of microbial pullulan. Carbohydr. Polym. 2017;173:573–591. doi: 10.1016/j.carbpol.2017.06.022. - DOI - PubMed

LinkOut - more resources