Randomized Controlled Trial
. 2024 Dec 11;16(24):4267.
doi: 10.3390/nu16244267.

Dietary Lipid Quantity and Quality Modulate the Postprandial Metabolomic Profile in Patients with Metabolic Syndrome

Affiliations
Randomized Controlled Trial

Dietary Lipid Quantity and Quality Modulate the Postprandial Metabolomic Profile in Patients with Metabolic Syndrome

Marina Mora-Ortiz et al. Nutrients. .

Abstract

The literature on the postprandial metabolic changes in individuals with Metabolic Syndrome (MetS) remains limited, despite the fact that postprandial states represent the most common physiological condition in Western societies.

Background/objectives: The objective of this study was to investigate the plasma metabolomics profile in both fasting and postprandial states following a high-fat challenge in individuals with MetS who consumed diets with varying quantities and qualities of dietary fat over 12 weeks.

Methods: Seventy-five patients with MetS (28 males and 47 females) from the Spanish LIPGENE cohort were included in the study. MetS patients were randomly stratified to follow one of four dietary interventions (isoenergetic diets) for a 12-week long-term study. The four diets were high in saturated fatty acids and high in monounsaturated fatty acids (HSFA and HMUFA), low-fat high-complex carbohydrates (LFHCC), and LFHCC supplemented with n-3. The metabolomics analysis of plasma samples was carried out using Liquid Chromatography Time-of-Flight Mass Spectrometry (LC-TOF/MS).

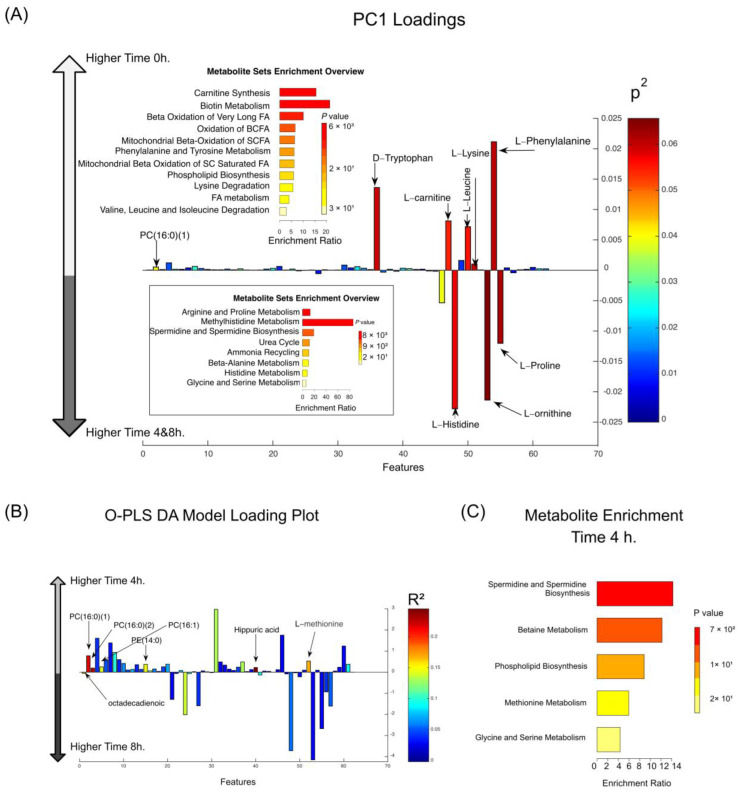
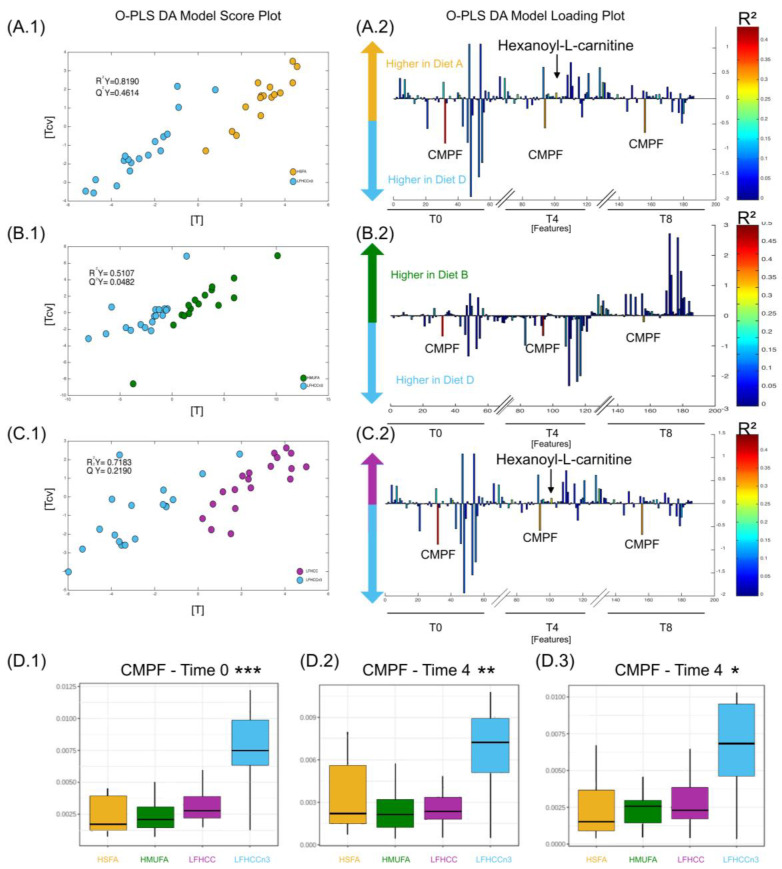
Results: We observed a decrease in inflammation biomarkers, including acetylcarnitine and L-carnitine during the fasting state and hexanoyl-L-carnitine and isobutyryl-L-carnitine during the postprandial period, mediated by the replacement of HSFA with HMUFA. Additionally, antioxidant compounds such as 4-hydroxybenzaldehyde and L-valine were expressed at higher levels after consumption of the HMUFA diet compared to the HSFA diet. HSFA also presented altered levels of phosphatidylcholine, a metabolite previously linked with insulin resistance.

Conclusions: These findings suggest that replacing HSFA with HMUFA may reduce inflammation and improve antioxidant profiles, supporting the potential for tailored dietary interventions in individuals with MetS.

Keywords: MUFAs; SFA; inflammation; metabolic syndrome; metabolomics; oxidative stress.


Conflict of interest statement

The authors declare no conflicts of interest.

Figures

Figure 1
Figure 1
Postprandial metabolomic changes in MetS patients were analyzed across time and dietary interventions. (Panel (A)): Principal Component Analysis (PCA) loading plot for PC1. PC1 distinguished fasting (Time 0 h) from the postprandial period (Time 4 h and 8 h), accounting for 21% of the matrix variance. Metabolites with higher abundance at 0 h (fasting) are represented on the positive Y-axis, while those increased at 4 h and 8 h (postprandial states) are on the negative Y-axis. The accompanying “Metabolite Set Enrichment Overview” highlights pathways modulated during fasting (top) and postprandial states (bottom). (Panel (B)): O-PLS-DA loading plot, showing metabolites contributing to the separation between 4 h and 8 h. Metabolites enriched at 4 h are on the positive Y-axis, while those more abundant at 8 h are on the negative Y-axis. (Panel (C)): Metabolite enrichment analysis highlighting pathways significantly altered at 4 h relative to 8 h, focusing on specific metabolic processes such as lipid metabolism, phospholipid biosynthesis, and amino acid pathways. Note: Data were obtained using LC-TOF/MS metabolomic profiling. Four dietary interventions were analyzed at three time points (0 h, 4 h, 8 h), allowing for the identification of both fasting and postprandial metabolomic changes.
Figure 2
Figure 2
Postprandial changes in metabolic syndrome (MetS) patients at different time points within each dietary intervention. (Panels (A1,A2)) High Saturated Fatty Acid (HSFA) diet comparing baseline (0 h) against 4 h postprandial (Panels (A1)) and baseline against 8 h (Panel (A2)). (Panels (B1,B2)) High Mono-unsaturated Fatty Acid (HMUFA) diet comparing baseline (0 h) against 4 h postprandial (Panels (B1)) and baseline against 8 h (Panel (B2)). (Panels (C1,C2)): low-fat high-complex carbohydrate (LFHCC) diet comparing baseline (0 h) against 4 h postprandial (Panels (C1)), and baseline against 8 h (Panel (C2)): low-fat high-complex carbohydrate supplemented with omega-3 fatty acids (LFHCCn3) diet comparing baseline (0 h) against 4 h postprandial (Panels (D1)), and baseline against 8 h (Panel (D2)). Metabolites are highlighted in red or blue to indicate increased or decreased abundance over time, respectively. Note: Data were obtained using LC-TOF/MS metabolomic profiling.
Figure 3
Figure 3
Postprandial metabolic differences between HSFA and HMUFA diets based on serum metabolite profiles. Loading plot from the OPLS-DA model (R2Y = 0.37, Q2Y = 0.04) showing postprandial metabolic changes at three time points: fasting (T0, white background), 4 h postprandial (T4, yellow background), and 8 h postprandial (T8, brown background). Metabolites contributing to the separation between diets and time points are highlighted. Note: Data were obtained using LC-TOF/MS metabolomic profiling.
Figure 4
Figure 4
Metabolomics analysis of plasma samples comparing the LFHCCn-3 diet to HSFA, HMUFA, and LFHCC diets. (Panel (A1)): OPLS-DA score plot for the pairwise comparison of the High Saturated Fatty Acid (HSFA) diet (ochre) and the low-fat high-complex carbohydrate diet supplemented with omega-3 (LFHCCn-3, blue). The model was calculated using all plasma metabolites as independent variables and diet as the predictor (R2Y = 0.82, Q2Y = 0.42). (Panel (A2)): Loading plot showing the metabolites of interest identified as contributors to the model. (Panel (B1)): OPLS-DA score plot for the pairwise comparison of the High Mono-unsaturated Fatty Acid (HMUFA) diet (green) and the LFHCCn-3 diet. The model was generated using all plasma metabolites as independent variables and diet as the predictor. (Panel (B2)): Loading plot showing the metabolites driving the separation between these diets. (Panel (C1)): OPLS-DA score plot and associated loading plot for the pairwise comparison of the low-fat high-complex carbohydrate (LFHCC) diet (purple) and the LFHCCn-3 diet, calculated as described above. (Panel (C2)): Loading plot showing the metabolites of interest identified as contributors to the model presented on (Panel (C1)). (D1D3): Boxplot illustrating the significantly higher concentrations of CMPF (3-carboxy-4-methyl-5-propyl-2-furanpropanoic acid) observed at fasting (0 h) and during the postprandial period (4 h and 8 h) for each diet in the interventional study. *: p-value = 0.05, **: p-value = 0.01, ***: p-value = 0.001.

References

    1. Garcia-Rios A., Delgado-Lista J., Perez-Martinez P., Delgado-Casado N., Perez-Jimenez F., Lopez-Miranda J. Relevance of Postprandial Lipemia in Metabolic Syndrome. Curr. Vasc. Pharmacol. 2013;11:920–927. doi: 10.2174/15701611113116660172. - DOI - PubMed
    1. Moller D.E., Kaufman K.D. Metabolic Syndrome: A Clinical and Molecular Perspective. Annu. Rev. Med. 2005;56:45–62. doi: 10.1146/annurev.med.56.082103.104751. - DOI - PubMed
    1. Huang P.L. A comprehensive definition for metabolic syndrome. Dis. Model. Mech. 2009;2:231–237. doi: 10.1242/dmm.001180. - DOI - PMC - PubMed
    1. Alberti K.G., Zimmet P.Z. Definition, diagnosis and classification of diabetes mellitus and its complications. Part 1: Diagnosis and classification of diabetes mellitus provisional report of a WHO consultation. Diabet. Med. 1998;15:539–553. doi: 10.1002/(SICI)1096-9136(199807)15:7<539::AID-DIA668>3.0.CO;2-S. - DOI - PubMed
    1. Saklayen M.G. The Global Epidemic of the Metabolic Syndrome. [(accessed on 29 March 2021)];Curr. Hypertens. Rep. 2018 20:12. doi: 10.1007/s11906-018-0812-z. Available online: https://www.ncbi.nlm.nih.gov/pmc/articles/PMC5866840/ - DOI - PMC - PubMed

Publication types

LinkOut - more resources