

Association of TyG Index and TG/HDL-C Ratio with Trajectories of Depressive Symptoms: Evidence from China Health and Retirement Longitudinal Study
- PMID: 39770920
- PMCID: PMC11676214
- DOI: 10.3390/nu16244300
Association of TyG Index and TG/HDL-C Ratio with Trajectories of Depressive Symptoms: Evidence from China Health and Retirement Longitudinal Study
Abstract
Objectives: To explore whether the triglyceride-glucose (TyG) index and the triglyceride to high-density lipoprotein cholesterol (TG/HDL-C) ratio are associated with the trajectories of depressive symptoms.
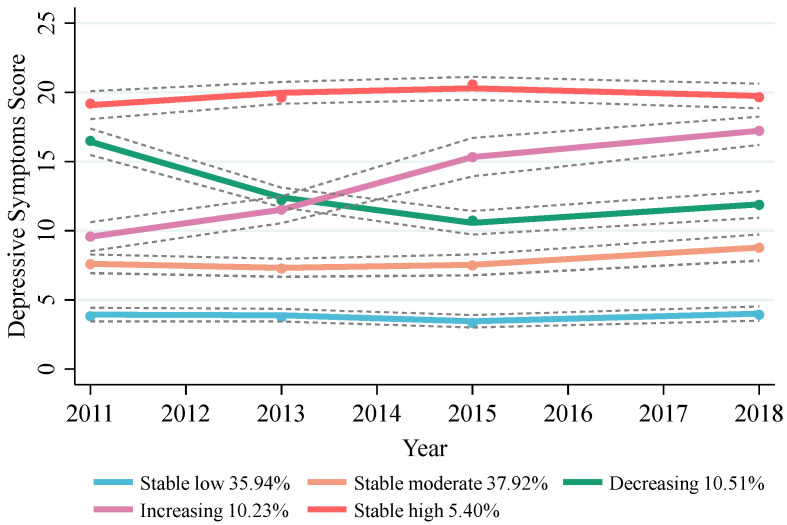
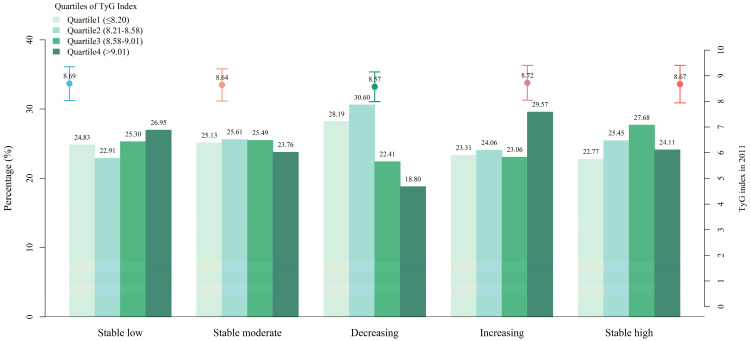
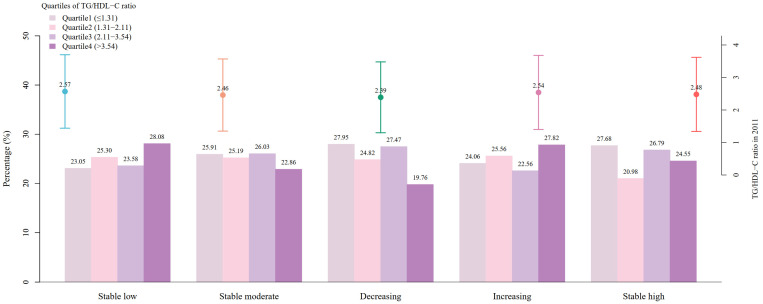
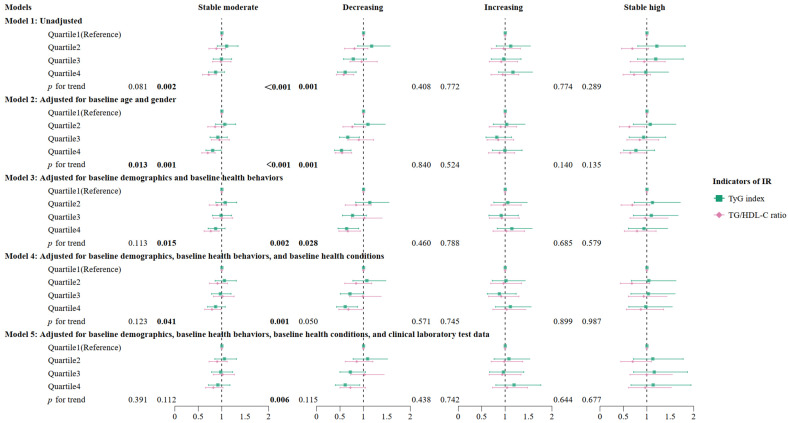
Methods: In this longitudinal study, 4215 participants aged 45 years and older were recruited from the China Health and Retirement Longitudinal Study from 2011 to 2018. The trajectories of depressive symptoms, measured by the 10-item Center for Epidemiologic Studies Depression Scale (CESD-10), were identified using group-based trajectory modeling. Multinomial logistic models and restricted cubic spline analysis were used to investigate the relationships between the TyG index and the TG/HDL-C ratio and the trajectories of depressive symptoms. Stratified analyses were conducted based on sex, age, place of residence, and body mass index (BMI).
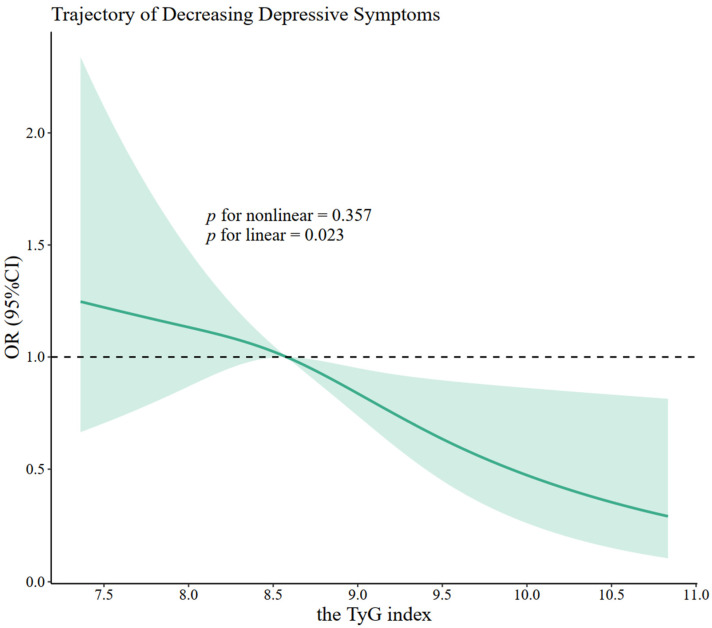
Results: Five distinct trajectories of depressive symptoms characterized by stable low, stable moderate, decreasing, increasing, and stable high were identified during a follow-up of 7 years. The associations of the TyG index and the TG/HDL-C ratio with trajectories of depressive symptoms are not entirely consistent. After adjusting for covariates, a higher TyG index at baseline was associated with lower odds of being on the decreasing trajectory of depressive symptoms (ORad = 0.61, 95% CI: 0.40-0.92) compared to the stable low trajectory, and restricted cubic spline analysis revealed a negative linear relationship between the TyG index and the likelihood of a decreasing trajectory of depressive symptoms. However, the relationship between the TG/HDL-C ratio and the decreasing trajectory of depressive symptoms was no longer statistically significant when all confounders were controlled (ORad = 0.72, 95% CI: 0.50-1.04). Additionally, this negative association between the TyG index and decreasing trajectory of depressive symptoms was observed among 45-64-year-old individuals, female participants, those living in rural areas, and those with a normal BMI.
Limitations: This study was conducted in a middle-aged and elderly population in China, and extrapolation to other regions and populations requires further confirmation.
Conclusions: Compared to the TG/HDL-C ratio, the TyG index may be a better predictor for trajectories of depressive symptoms in middle-aged and older adults. Considering that the pathology of depression progresses long term, our findings may have utility for identifying available and reliable markers for the development of depression.
Keywords: TG/HDL-C ratio; depressive symptoms; longitudinal study; trajectory; triglyceride–glucose (TyG) index.
Conflict of interest statement
The authors declare no conflicts of interest. The funders had no role in the design of the study; in the collection, analyses, or interpretation of data; in the writing of the manuscript; or in the decision to publish the results.
Figures
References
-
- Ferrari A.J., Santomauro D.F., Aali A., Abate Y.H., Abbafati C., Abbastabar H., Abd ElHafeez S., Abdelmasseh M., Abd-Elsalam S., Abdollahi A., et al. Global incidence, prevalence, years lived with disability (YLDs), disability-adjusted life-years (DALYs), and healthy life expectancy (HALE) for 371 diseases and injuries in 204 countries and territories and 811 subnational locations, 1990–2021: A systematic analysis for the Global Burden of Disease Study 2021. Lancet. 2024;403:2133–2161. doi: 10.1016/S0140-6736(24)00757-8. - DOI - PMC - PubMed
MeSH terms
Substances
Grants and funding
LinkOut - more resources
Full Text Sources
Medical
Miscellaneous
