. 2024 Dec 13;16(24):4310.
doi: 10.3390/nu16244310.

Transcriptional and Metabolic Changes Following Repeated Fasting and Refeeding of Adipose Stem Cells Highlight Adipose Tissue Resilience

Affiliations

Transcriptional and Metabolic Changes Following Repeated Fasting and Refeeding of Adipose Stem Cells Highlight Adipose Tissue Resilience

Natalia M Galigniana et al. Nutrients. .

Abstract

Background: Obesity and related metabolic disorders have reached epidemic levels, calling for diverse therapeutic strategies. Altering nutrient intake, timing and quantity by intermittent fasting seems to elicit beneficial health effects by modulating endocrine and cell signaling networks. This study explores the impact of cyclic nutrient availability in the form of every-other-day fasting (EODF) on human adipose stem cells (ASCs).

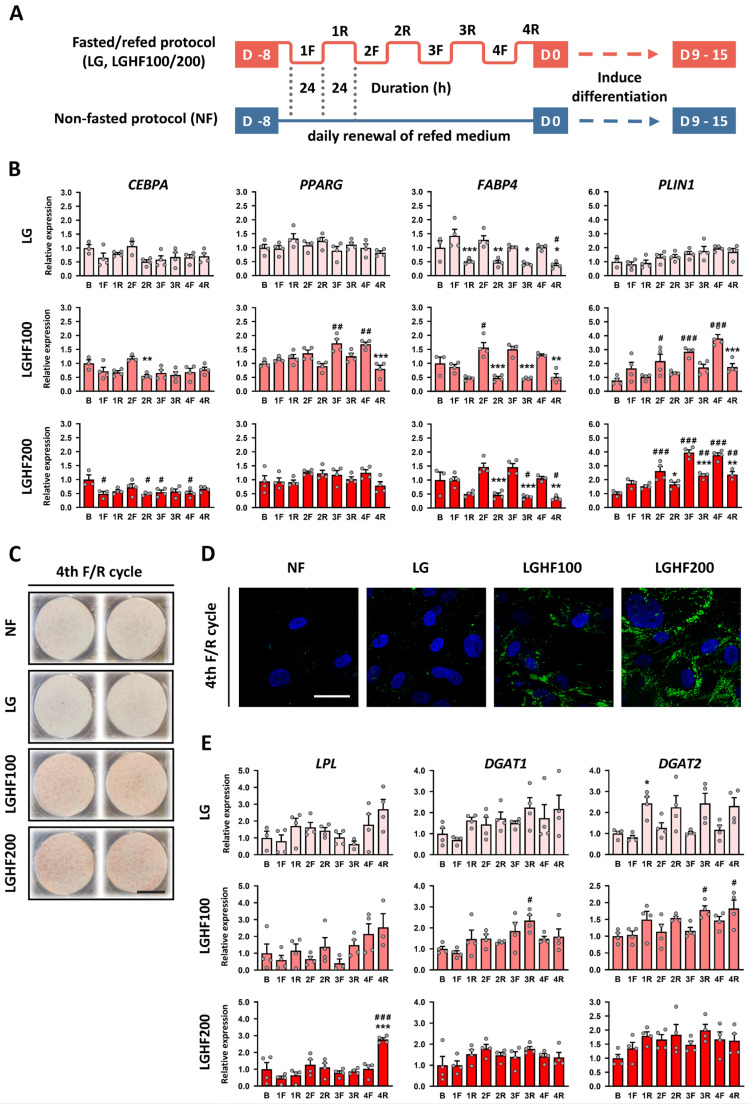
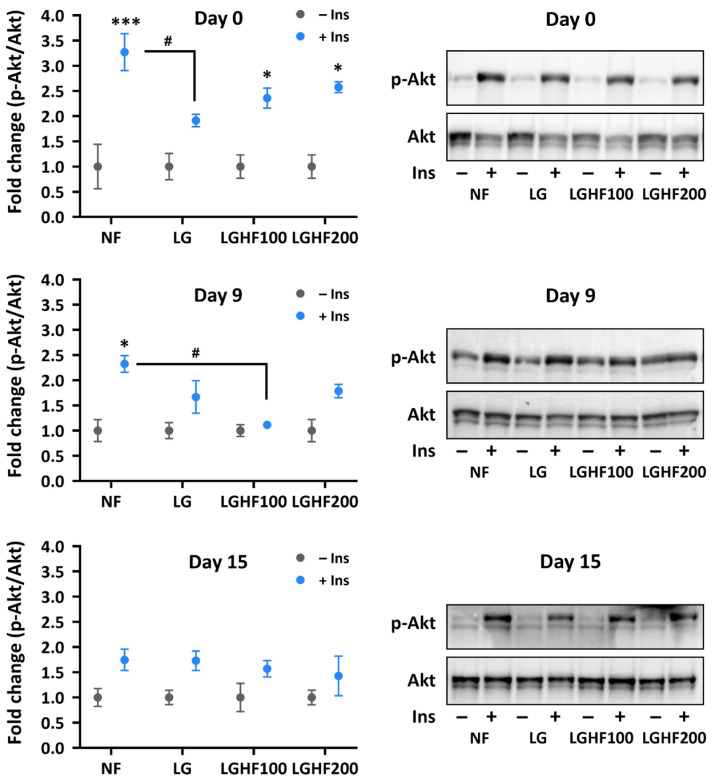
Methods: We subjected ASCs to repeated fasting/refeeding (F/R) cycles, mimicking low glucose/high fatty acid (LGHF) conditions, and assessed phenotypic and transcriptomic changes, lipid storage capacity, insulin sensitivity, and differentiation potential.

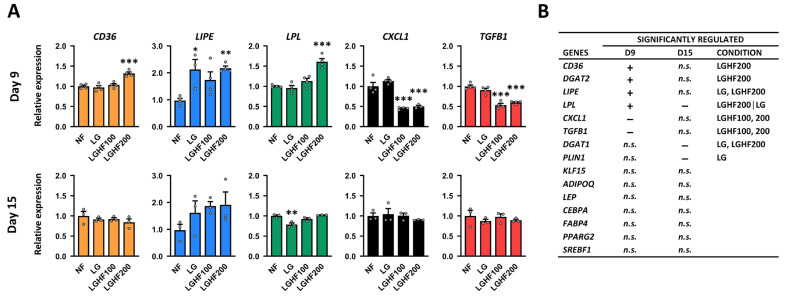
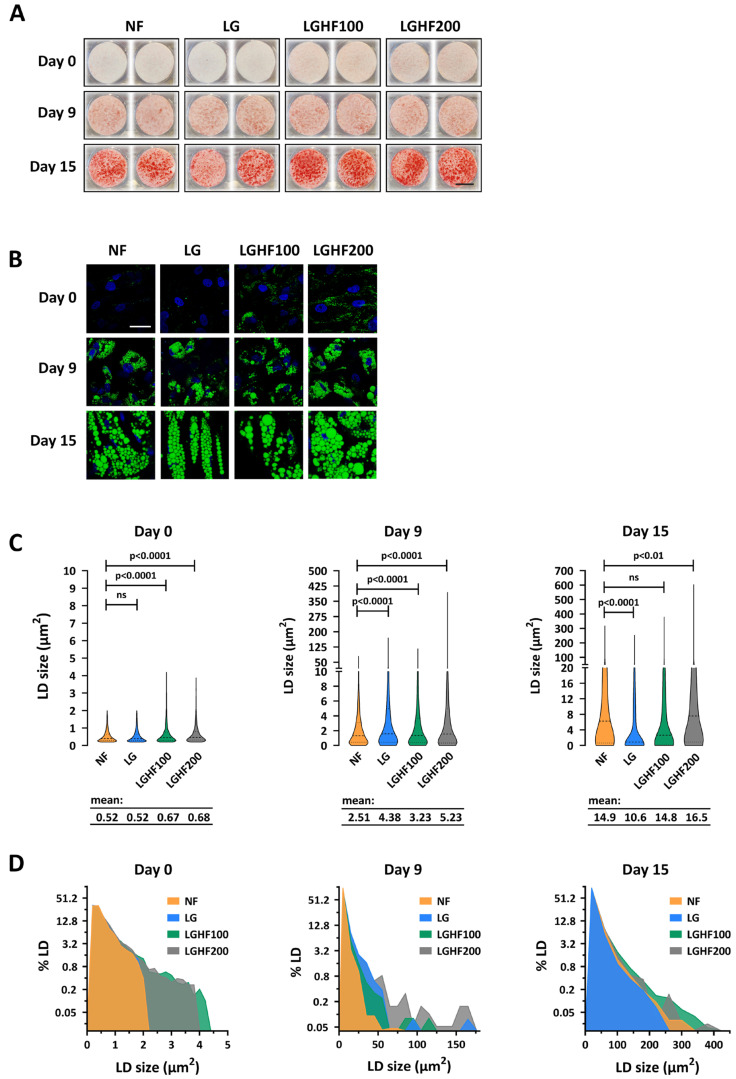
Results: Four consecutive F/R cycles induced significant changes in adipogenic gene expression, with upregulation of FABP4 and PLIN1 during fasting, and increased lipid storage in the ASCs. Upon differentiation, ASCs exposed to LGHF conditions retained a transient increase in lipid droplet size and altered fatty acid metabolism gene expression until day 9. However, these changes dissipated by day 15 of differentiation, suggesting a limited duration of fasting-induced transcriptional and adipogenic memory. Despite initial effects, ASCs showed resilience, returning to a physiological trajectory during differentiation, with respect to gene expression and lipid metabolism.

Conclusions: These findings suggest that the long-term effects of EODF on the ASC niche may be transient, emphasizing the ability of the adipose tissue to adapt and restore homeostasis.

Keywords: adipogenesis; intermittent fasting; metabolic memory; resilience.


Conflict of interest statement

The authors declare no conflicts of interest.

Figures

Figure 1
Figure 1
Repeated cycles of in vitro fasting and refeeding elicit changes in the expression of adipogenic genes and increase the storage of neutral lipids in ASCs. (A) Experimental design: Human adipose stem cells (ASCs) were fasted for 24 h in low glucose (LG; 5 mM glucose) or low glucose/high fatty acid medium (LGHF100/200; 5 mM glucose + 100 or 200 μM oleic acid) and then refed for 24 h with high glucose/low fatty acid medium (HGLF; 17.5 mM glucose). This was performed four times. For the non-fasted protocol (NF), the cells were cultured in HGLF medium for 8 days, with daily medium changes. (B) Relative expression of adipogenic marker genes in non-proliferating ASCs being subjected to different fasting and refeeding regimens. ASCs that had gone through four fasting and refeeding cycles were fixed with paraformaldehyde and neutral lipids stained with (C) Oil Red O, scale bar: 1 cm, or (D) BODIPY, scale bar: 40 µM. The pictures shown are representative of three biological replicates. (E) Relative expression of esterification genes. The gene expression data are presented as mean fold-change ± SEM of 3–4 biological replicates. Fasted (F) vs. Refed (R): * p < 0.05, ** p < 0.01, *** p < 0.001 and Basal (B) vs. F or R: # p < 0.05, ## p < 0.01, ### p < 0.001, determined by one-way ANOVA with Tukey’s multiple comparison test. NF: non-fasted; LG: low glucose; LGHF100/200: low glucose/high fatty acid (100/200 μM oleic acid).
Figure 2
Figure 2
F/R cycled ASCs display a lipolytic/re-esterifying gene profile during adipogenic differentiation. (A) Expression of selected genes in differentiating ASCs subjected to prior fasting and refeeding regimens relative to NF cells. (B) Table view of all genes analyzed by qPCR being significantly upregulated (+), downregulated (−) or unaffected (n.s.) in F/R cycled adipocytes on day 9 or day 15 of differentiation relative to NF cells. The corresponding graphs can be found in Figure S1. The data are presented as mean fold-change ± SEM of 3–4 biological replicates. * p < 0.05, ** p < 0.01, *** p < 0.001 as determined by one-way ANOVA with Dunnett’s multiple comparison test. NF: non-fasted; LG: low glucose; LGHF100/200: low glucose/high fatty acid (100/200 μM oleic acid); n.s: non-significant.
Figure 3
Figure 3
Lipid droplet dynamics during differentiation of fasted and refed ASCs. Differentiating ASCs subjected to prior fasting and refeeding regimens were fixed with paraformaldehyde on day 0, 9,and 15 after start of differentiation, and neutral lipids stained with (A) Oil Red O, scale bar: 1 cm, or (B) BODIPY, scale bar: 40 µM. Lipid droplets (LDs) were quantified using Fiji and presented as (C) violin plots (median + quartiles) and (D) frequency plots (bin width day 0: 0.2 μm2; day 9: 10 μm2; day 15: 40 μm2). The plots are calculated based on three biological replicates. The Y-axes are plotted with log2 scale, and the Day 9 X-axis cropped at 180 μm2 to highlight the differences. Significance levels were determined by unpaired, two-tailed t test. NF: non-fasted; LG: low glucose; LGHF100/200: low glucose/high fatty acid (100/200 μM oleic acid).
Figure 4
Figure 4
Insulin sensitivity is reduced in adipocytes during adipogenic differentiation, independent of prior fasting and refeeding. Differentiating ASCs subjected or not to prior fasting and refeeding regimens were serum-deprived overnight and stimulated with 10 nM insulin for 10 min on day 0, 9, and 15 after start of differentiation. The relative level of phosphorylated Akt was determined by immunoblotting with phoshpo-Ser473 and total Akt antibodies and densitometric quantification of the resulting blots. The data are presented as mean p-Akt/Akt ratio ± SEM of 2–3 biological replicates. One representative immunoblot is shown per time point. Insulin-stimulated vs. non-stimulated: * p < 0.05, *** p < 0.001, and insulin-stimulated vs. insulin-stimulated between different F/R regimens: # p < 0.05, as determined by two-way ANOVA with Tukey’s multiple comparisons test. Only significant differences are indicated in the figure. NF: non-fasted; LG: low glucose; LGHF100/200: low glucose/high fatty acid (100/200 μM oleic acid).
Figure 5
Figure 5
F/R cycling-dependent activation of functional pathways are lost by day 15 of differentiation. Total RNA sequencing was performed on ASCs at baseline (Day 0; n = 5, 3 donors), following either four F/R cycles or 8 days in standard culture medium, and after consecutive induction of differentiation on Day 9 and Day 15 under the same prior conditions (n = 3, 1 donor). (A) Differentially expressed genes (DEGs) between time points and pre-treatments in differentiating ASCs (FDR-adjusted p-value < 0.05). (B) Venn diagram of DEGs in LG- and LGHF100-cycled compared to NF cells on day 0. (C) The intersecting DEGs from (B) were tested for overrepresentation against the Reactome gene sets. (D) Gene set enrichment analysis (GSEA) with the MSigDB Hallmark gene set. NF: non-fasted; LG: low glucose; LGHF100: low glucose/high fatty acid (100 μM oleic acid).

Similar articles

References

    1. World Obesity Federation . World Obesity Atlas 2023. World Obesity Federation; London, UK: 2023. p. 232.
    1. Longo V.D., Panda S. Fasting, Circadian Rhythms, and Time-Restricted Feeding in Healthy Lifespan. Cell Metab. 2016;23:1048–1059. doi: 10.1016/j.cmet.2016.06.001. - DOI - PMC - PubMed
    1. Wilson K.A., Chamoli M., Hilsabeck T.A., Pandey M., Bansal S., Chawla G., Kapahi P. Evaluating the beneficial effects of dietary restrictions: A framework for precision nutrigeroscience. Cell Metab. 2021;33:2142–2173. doi: 10.1016/j.cmet.2021.08.018. - DOI - PMC - PubMed
    1. Green C.L., Lamming D.W., Fontana L. Molecular mechanisms of dietary restriction promoting health and longevity. Nat. Rev. Mol. Cell Biol. 2022;23:56–73. doi: 10.1038/s41580-021-00411-4. - DOI - PMC - PubMed
    1. Varady K.A., Cienfuegos S., Ezpeleta M., Gabel K. Clinical application of intermittent fasting for weight loss: Progress and future directions. Nat. Rev. Endocrinol. 2022;18:309–321. doi: 10.1038/s41574-022-00638-x. - DOI - PubMed