

Assessing Lifestyle in a Large Cohort of Undergraduate Students: Significance of Stress, Exercise and Nutrition
- PMID: 39770960
- PMCID: PMC11677779
- DOI: 10.3390/nu16244339
Assessing Lifestyle in a Large Cohort of Undergraduate Students: Significance of Stress, Exercise and Nutrition
Abstract
Background/objectives: Lifestyle (in particular, nutrition and exercise) determines present and future youths' health. The goal of the present study was to identify specific student groups who deserve precise lifestyle improvement interventions, tailored to their characteristics.
Methods: An anonymous web-based questionnaire to assess lifestyle was posted on the websites of two main Italian Academic Institutions, and 9423 students voluntarily participated. A personalised immediate report was provided to improve compliance/motivation. We assessed age, sex, affiliation, anthropometrics, lifestyle components (nutrition, exercise, sedentariness, stress perception, smoking, alcohol, sleep), and the desire to be helped with lifestyle improvement. Cluster analysis was performed to identify healthy lifestyle groups among the students.
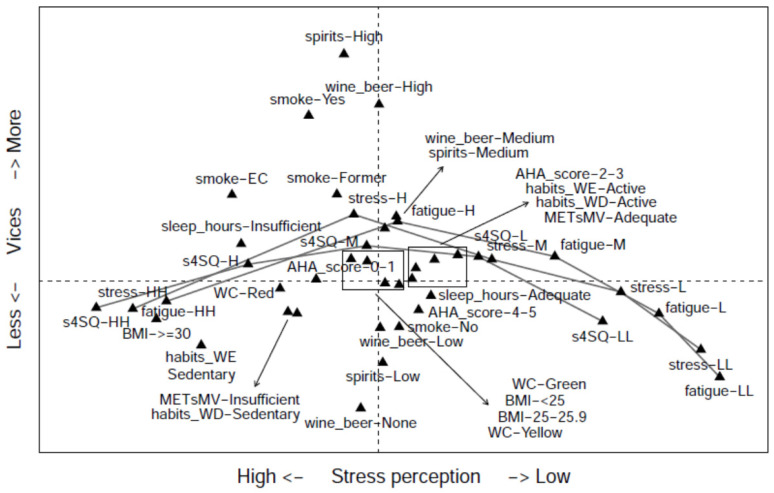
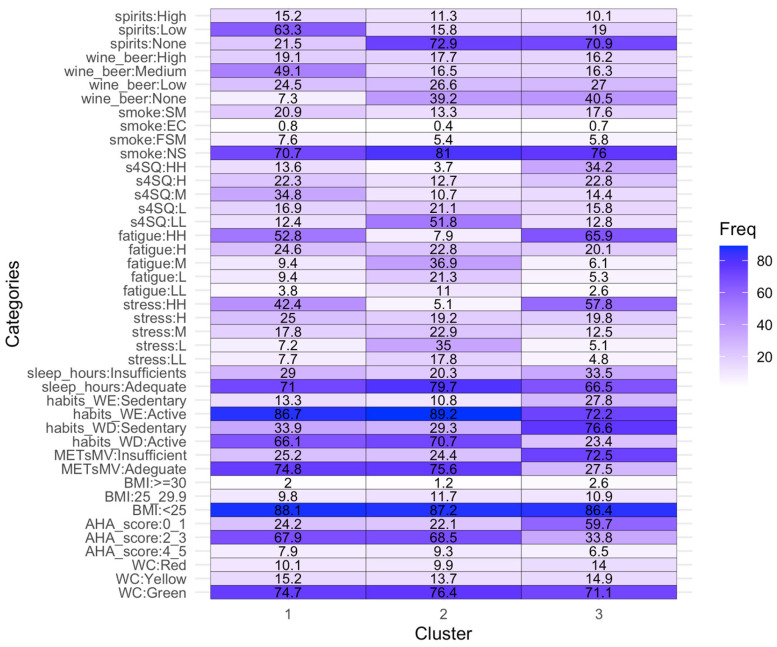
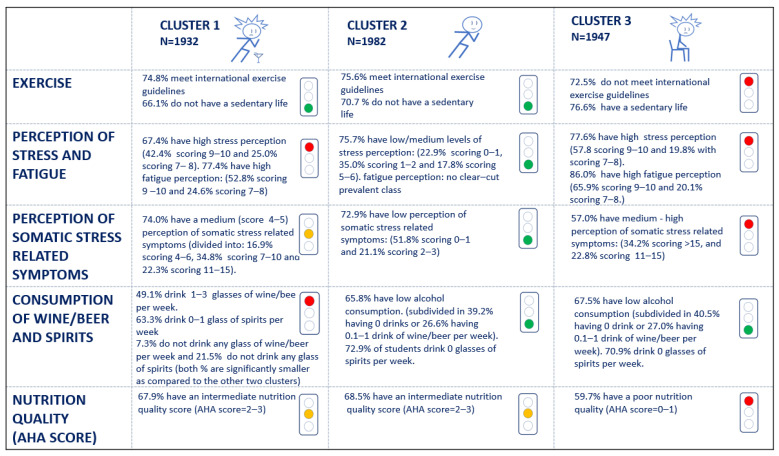
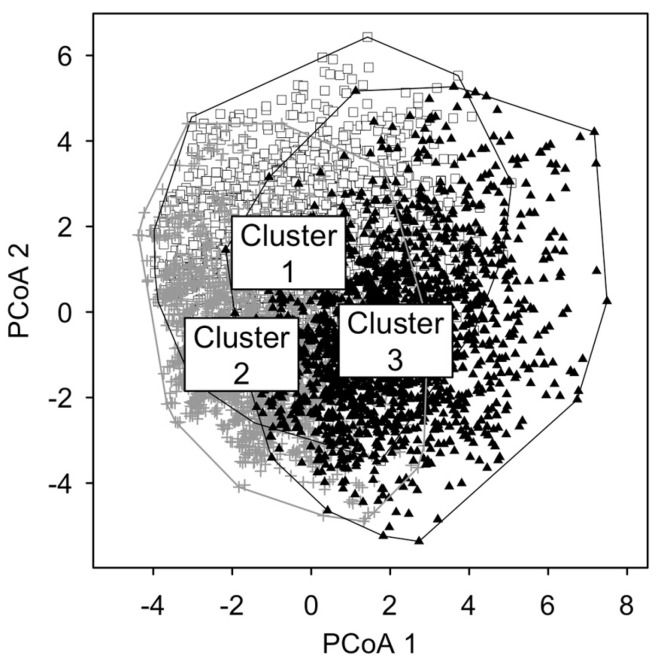
Results: In total, 6976 subjects [age: 21 (20, 23) yrs; 3665 female, 3300 male] completed the questionnaire and were included. Of these students, 73.9% expressed the need for lifestyle improvement help, particularly for becoming physically active (66.7%), managing stress (58.7%), and improving nutrition (52.7%). We unveil three clusters of subjects, each corresponding to a distinct lifestyle pattern. The clusters are differentiated by exercise level and perceptions of stress/fatigue/somatic symptoms (cluster 1: 74.8% meet international exercise guidelines (IEGs), 67.4% have high stress perception, 49.1% drink 1-3 glasses of wine/beer per week, and 63.3% drink 0-1 glass of spirits per week; cluster 2: 75.6% meet IEGs, 75.7% have low/medium levels of stress perception, and 65.8% have low alcohol consumption; cluster 3: 72.5% do not meet IEGs, 77.6% have high stress perception, and 67.5% have low alcohol consumption). More active students present lower stress/somatic symptoms perception. Interestingly, the AHA diet score (nutrition quality) was not in the ideal range in any cluster (nevertheless, obesity was not of concern), being worst in cluster 3, characterized by higher stress perception (59.7% had poor nutrition quality). Those who were physically active but showed a high stress/fatigue perception were used to drinking alcohol.
Conclusions: Students desire help to improve their lifestyle, and this approach might help identify specific student groups to whom LIs in Academic Institutions can be tailored to foster well-being and promote health.
Keywords: lifestyle assessment; nutrition quality; physical activity; public health; stress management; tailored intervention; well-being.
Conflict of interest statement
The authors declare no conflicts of interest.
Figures
References
-
- Bonnie R.J., Stroud C., Breiner H. Investing in the Health and Well-Being of Young Adults. National Academies Press; Washington, DC, USA: 2015. - PubMed
-
- Wald A., Muennig P.A., O’Connell K.A., Garber C.E. Associations between Healthy Lifestyle Behaviors and Academic Performance in U.S. Undergraduates: A Secondary Analysis of the American College Health Association’s National College Health Assessment Ii. Am. J. Health Promot. 2014;28:298–305. doi: 10.4278/ajhp.120518-QUAN-265. - DOI - PubMed
-
- Llorent-Bedmar V., Torres-Zaragoza L., Navarro-Granados M., Ballesteros-Moscosio M.Á. Healthy Lifestyle Habits Among Students at the University of Seville, Spain. J. Educ. Community Health. 2022;9:208–214. doi: 10.34172/jech.2022.2016. - DOI
-
- Carballo-Fazanes A., Rico-Díaz J., Barcala-Furelos R., Rey E., Rodríguez-Fernández J.E., Varela-Casal C., Abelairas-Gómez C. Physical Activity Habits and Determinants, Sedentary Behaviour and Lifestyle in University Students. Int. J. Environ. Res. Public Health. 2020;17:3272. doi: 10.3390/ijerph17093272. - DOI - PMC - PubMed
MeSH terms
LinkOut - more resources
Full Text Sources
Medical
