. 2024 Dec 17;16(24):4344.
doi: 10.3390/nu16244344.

Impact of Omega-3 on Endocannabinoid System Expression and Function, Enhancing Cognition and Behavior in Male Mice

Affiliations

Impact of Omega-3 on Endocannabinoid System Expression and Function, Enhancing Cognition and Behavior in Male Mice

Maitane Serrano et al. Nutrients. .

Abstract

Background/Objectives: Omega-3 long-chain polyunsaturated fatty acids (PUFAs) support brain cell membrane integrity and help mitigate synaptic plasticity deficits. The endocannabinoid system (ECS) is integral to synaptic plasticity and regulates various brain functions. While PUFAs influence the ECS, the effects of omega-3 on the ECS, cognition, and behavior in a healthy brain remain unclear. Methods and Results: Here, we demonstrate that hippocampal synaptosomes from male mice fed an omega-3-rich diet exhibit increased levels of cannabinoid CB1 receptors (~30%), phospholipase C β1 (PLCβ1, ~30%), monoacylglycerol lipase (MAGL, ~30%), and cannabinoid receptor-interacting protein 1a (Crip1a, ~60%). Conversely, these synaptosomes show decreased levels of diacylglycerol lipase α (DAGLα, ~40%), synaptosomal-associated protein 25kDa (SNAP-25, ~30%), and postsynaptic density protein 95 (PSD-95, ~40%). Omega-3 intake also reduces Gαo and Gαi3 levels, though receptor-stimulated [35S]GTPγS binding remains unaffected. Stimulation of the medial perforant path (MPP) induced long-term potentiation (LTP) in omega-3-fed mice. This LTP was dependent on group I metabotropic glutamate receptors (mGluR), 2 arachidonoylglycerol (2-AG), CB1 receptors, N-type Ca2+ channels, and actin filaments. Behaviorally, omega-3-fed mice displayed reduced exploratory behavior and significantly improved object discrimination in the novel object recognition test (NORT). They also spent more time in open arms and exhibited reduced freezing time in the elevated plus maze (EPM), indicative of reduced anxiety-like behavior. Conclusions: Our findings suggest that omega-3 leverages the ECS to enhance brain function under normal conditions.

Keywords: CB1 receptor; hippocampus; memory; polyunsaturated fatty acids; synaptic plasticity.


Conflict of interest statement

The authors declare no conflicts of interest.

Figures

Figure 1
Figure 1
Dietary calorie consumption and omega-3 (n-3), EPA, and DHA intake. (A) Calorie intake (kcal/day) during young adulthood (PND 56–71). (B) Total n-3 intake (mg/kg/day). (C) EPA + DHA intake (mg/kg/day). Control group, n = 12; n-3 group, n = 12. Data are presented as mean ± SEM; Mann–Whitney test; **** p < 0.0001.
Figure 2
Figure 2
CB1 and Crip1a protein expression in hippocampal whole homogenates and synaptosomes. (A,B) Representative Western blots of CB1 and Crip1a expression carried out by immunoblotting increasing amounts of total protein from hippocampal whole homogenates (wH) or synaptosomes (Syn). The total protein loading was checked by Coomassie Brilliant Blue gel staining. Protein migration was consistent with their expected molecular mass (CB1, 52.8 kDa; Crip1a, 18.6 kDa). The molecular weights depicted correspond to the signal of the standard markers. (C) CB1 and Crip1a expression in whole homogenates. (D) CB1 and Crip1a expression in synaptosomes. Data are presented as mean ± SEM (see Table 4), with squares representing individual experimental values, using a synaptosomal or whole homogenate fraction obtained from two fractionation procedures and including hippocampal pools from at least six adult mice per fractionation procedure. Statistical analysis: paired ratio t-test; ** p < 0.01, **** p < 0.0001.
Figure 3
Figure 3
Relative expression of Gαi/o subunits, main 2-AG-related enzymes, and synaptic proteins in hippocampal synaptosomes (Syn). (A) Representative Western blots carried out by immunoblotting increasing amounts of hippocampal synaptosomes. The total protein loading was checked by Coomassie Brilliant Blue gel staining. Protein migration was consistent with their expected molecular mass (PLCβ1, 138.3 kDa; DAGLα, 115.3 kDa; DAGLβ, 73.9 kDa; MAGL, 33.3 kDa; Gαo 40.1 kDa; Gαi1, 40.5 kDa; Gαi2, 40.4 kDa; Gαi3, 40.5 kDa; PSD-95, 80.4 kDa; SNAP-25, 23.3 kDa). The molecular weights depicted correspond to the signal of the standard markers. (B) Gαo, Gαi1, Gαi2, and Gαi3 expression in synaptosomes. (C) PLCβ1, DAGLα, DAGLβ, and MAGL expression in synaptosomes. (D) SNAP-25 and PSD-95 expression in synaptosomes. Data are presented as mean ± SEM (see Table 4) with squares representing individual experimental values, using synaptosome membranes obtained from two fractionation procedures and including hippocampal pools from at least six adult mice per fractionation procedure. Statistical analysis: Paired ratio t-test; * p < 0.05, ** p < 0.01, *** p < 0.001.
Figure 4
Figure 4
CB1 receptor coupling to Gαi/o proteins in hippocampal synaptosomes from control and omega-3 (n-3) mice. Concentration–response curves for CP 55,940-stimulated [35S]GTPγS binding. Curves represent mean ± SEM from triplicate data points of three independent experiments. Emax values are expressed as % specific [35S]GTPγS bound of basal. The inset shows the ratio of Emax to CB1 receptor expression values (determined by Western blot).
Figure 5
Figure 5
Omega-3 (n-3)-enriched diet induces CB1-mediated excitatory synaptic transmission and MPP-LTP. (A) Input–output curves: mean fEPSP areas (mV/ms) plotted against stimulation intensities in hippocampal slices from control (gray squares, n = 8) and n-3 (black circles, n = 14) mice. Data are mean ± SEM, analyzed by unpaired t-test. (B) Time course plot in control mice: WIN-2 (5 μM) (black and white circles) decreases fEPSP, while WIN-2 (5 μM) + AM251 (4 μM) (white circles) has no effect. Data are mean ± SEM; unpaired t-test, * p < 0.05 vs. baseline. (C) In n-3 mice, WIN-2 (5 μM) (gray squares) increases fEPSP, whereas WIN-2 (5 μM) + AM251 (4 μM) (black squares) shows no effect. Data are mean ± SEM; unpaired t-test, * p < 0.05 vs. baseline. (D) Summary bar graph for control + WIN-2 (5 μM), n-3 + WIN-2 (5 μM), control + WIN-2 (5 μM) + AM251 (4 μM), and n-3 + WIN-2 (5 μM) + AM251 (4 μM). Numbers within the bars are individual experiments; data are mean ± SEM, analyzed by one-way ANOVA with Dunn’s multiple comparisons test, ** p < 0.01, **** p < 0.0001. (E) Top: averaged fEPSP traces showing the effect of LFS (10 min, 10 Hz) over the last 10 min. LFS induces MPP-LTD in control mice (gray line) and MPP-LTP in n-3 mice (gray line). Bottom: LFS triggers MPP-LTD in control (white circles) and MPP-LTP in n-3 (gray squares). Data are mean ± SEM; Student’s t-test, * p < 0.05, ** p < 0.01 vs. baseline. (F) Summary bar graph of MPP-LTD and MPP-LTP. Numbers within the bars are individual experiments; data are mean ± SEM; Student’s t-test, **** p < 0.0001.
Figure 6
Figure 6
MPP-LTP in omega-3 (n-3) mice is mediated by CB1, group I mGluRs, and 2-AG. Hippocampal slices were obtained from n = 14 mice. (AJ) Effects of pharmacological inhibitors on MPP-LTP in n-3 mice, shown with black triangles: (A) AM251 (4 µM): paired t-test, ** p < 0.01 vs. baseline. (B) AMG9810 (3 µM): Wilcoxon test, * p < 0.05 vs. baseline. (C) MPEP (10 µM): paired t-test, * p < 0.05 vs. baseline. (D) THL (10 µM): paired t-test, p > 0.05 vs. baseline. (E) RHC 80,287 (100 µM): paired t-test, p > 0.05 vs. baseline. (F) D-AP5 (50 µM): Wilcoxon test, * p < 0.05 vs. baseline. (G) LAT-A (500 µM): paired t-test, p > 0.05 vs. baseline. (H) ω-Conotoxin GVIA (1 µM): paired t-test, p > 0.05 vs. baseline. (I) CPCCoEt (50 µM): paired t-test, p > 0.05 vs. baseline. (J) LEI401 (10 µM): Wilcoxon test, p > 0.05 vs. baseline. (K) Summary bar graph displaying results for: n-3, n-3 + AM251 (4 µM), n-3 + AMG9810 (3 µM), n-3 + MPEP (10 µM), n-3 + THL (10 µM), n-3 + RHC 80,287 (100 µM), n-3 + D-AP5 (50 µM), n-3 + LAT-A (500 µM), n-3 + ω-Conotoxin GVIA (1 µM), n-3 + CPCCoEt (50 µM), and n-3 + LEI401 (10 µM). Numbers within the bars indicate individual experiments; data are expressed as mean ± SEM. Statistical analysis: Dunn’s test; ** p < 0.01, *** p < 0.001, **** p < 0.0001.
Figure 7
Figure 7
Novel object recognition test. (A) Total exploration time (s) spent with objects on the acquisition day (unpaired t-test). (B) Total exploration time (s) spent with objects on the test day (Mann–Whitney test). (C) Discrimination index on the test day (unpaired t-test). Control group, n = 18; n-3 group, n = 12. Black circles and gray squares represent individual values. Data are presented as mean ± SEM; ** p < 0.01, *** p < 0.001.
Figure 8
Figure 8
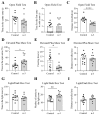
Anxiety- like behavior analysis using the OF, EPM, and LDB tests. (A) Total time (s) spent in the center zone of the open field (OF) maze (unpaired t-test). (B) Time (s) spent in the center zone before first entry into the safe zone of the OF (Mann–Whitney test). (C) Distance traveled (m) in the OF (unpaired t-test). (D) Percentage of time (%) spent in the open arms of the elevated plus maze (EPM) (unpaired t-test). (E) Freezing time (s) during the EPM test (Mann–Whitney test). (F) Distance traveled (m) in the EPM (unpaired t-test). (G) Total time (s) spent in the light zone of the light/dark box (LDB) (unpaired t-test). (H) Number of entries into the light zone of the LDB (Mann–Whitney test). (I) Distance traveled (m) in the LDB (unpaired t-test). Control group, n = 12; n-3 group, n = 12. Black circles and gray squares represent individual values. Data are presented as mean ± SEM; * p < 0.05, ** p < 0.01, **** p < 0.0001.

Similar articles

Cited by

References

    1. Abedi E., Sahari M.A. Long-chain polyunsaturated fatty acid sources and evaluation of their nutritional and functional properties. Food Sci. Nutr. 2014;2:443–463. doi: 10.1002/fsn3.121. - DOI - PMC - PubMed
    1. Aguilera García C., Navarro Alarcón M., Alonso Aperte E., Alvarez Mercado A.I., Andrés Carvajales P., Arredondo Olguín M. Tratado de Nutrición. Tomo I. Bases Fisiológicas y Bioquímicas de la Nutrición. Médica Panamericana; Madrid, Spain: 2010. 963p
    1. Gómez Candela C., Bermejo López L.M., Loria Kohen V. Importance of a balanced omega 6/omega 3 ratio for the maintenance of health. Nutritional recommendations. Nutr. Hosp. 2011;26:323–329. - PubMed
    1. Serrano M., Rico-Barrio I., Grandes P. The effect of omega-3 fatty acids on alcohol-induced damage. Front. Nutr. 2023;10:1068343. doi: 10.3389/fnut.2023.1068343. - DOI - PMC - PubMed
    1. Venegas-Calerón M., Sayanova O., Napier J.A. An alternative to fish oils: Metabolic engineering of oil-seed crops to produce omega-3 long chain polyunsaturated fatty acids. Prog. Lipid Res. 2010;49:108–119. doi: 10.1016/j.plipres.2009.10.001. - DOI - PubMed

LinkOut - more resources