Meta-Analysis
. 2024 Dec 17;16(24):4350.
doi: 10.3390/nu16244350.

Association of Protein Intake with Sarcopenia and Related Indicators Among Korean Older Adults: A Systematic Review and Meta-Analysis

Affiliations
Meta-Analysis

Association of Protein Intake with Sarcopenia and Related Indicators Among Korean Older Adults: A Systematic Review and Meta-Analysis

Minjee Han et al. Nutrients. .

Abstract

Objectives: Due to variations in the standards for optimal protein intake and conflicting results across studies for Korean older adults, this study aimed to quantitatively integrate existing research on the association of protein intake with sarcopenia and related indicators in Koreans aged 65 and older through meta-analysis.

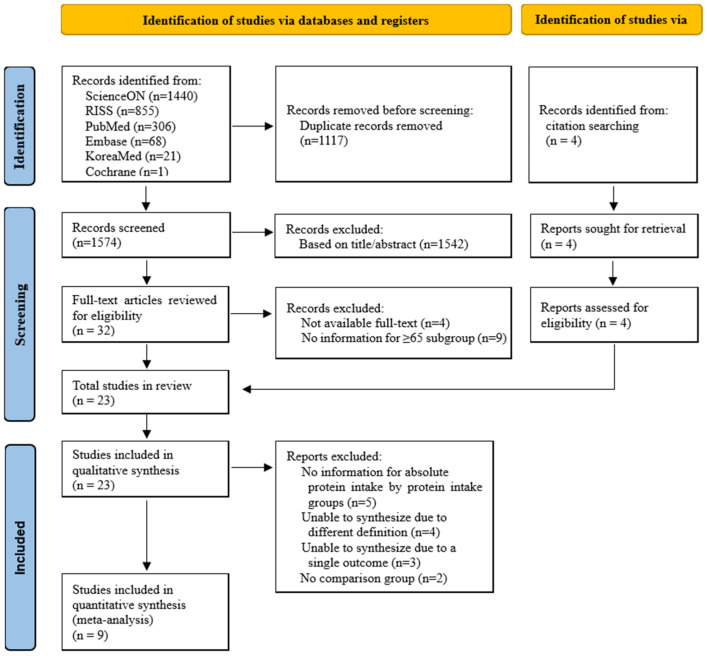
Methods: A total of 23 studies were selected according to the study selection criteria (PICOS). Sixteen cross-sectional studies, 5 randomized controlled trials (RCTs), and 2 non-RCTs were included in the review, with 9 out of 23 studies included in the meta-analysis. We used fixed-effects models and performed subgroup and sensitivity analyses.

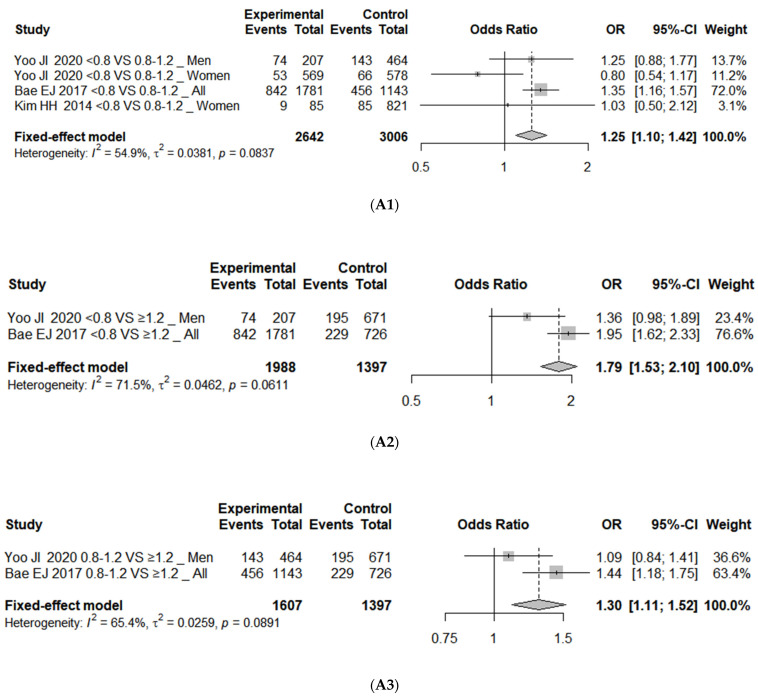
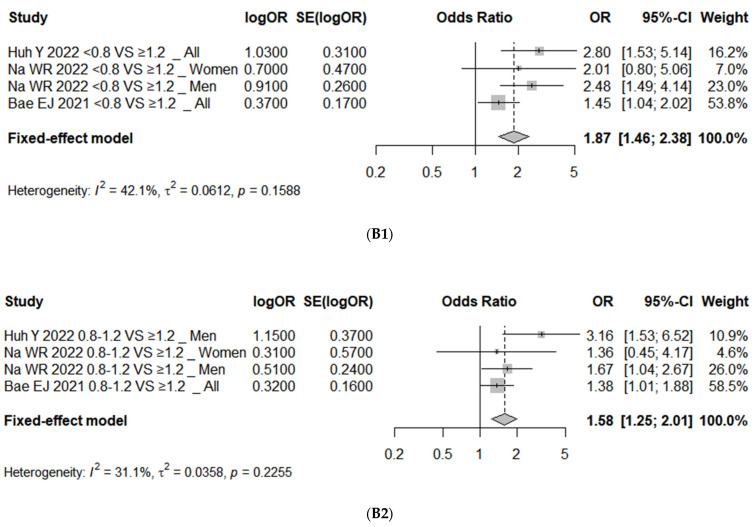
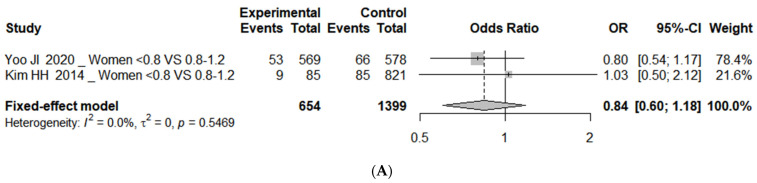
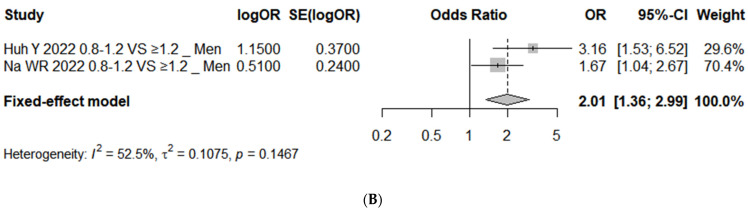
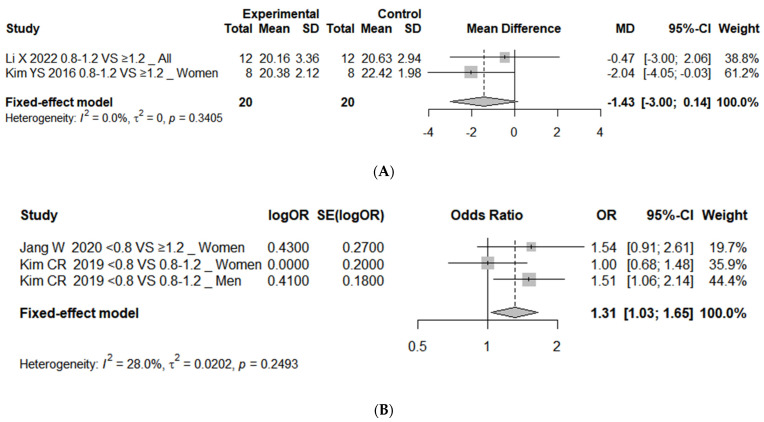
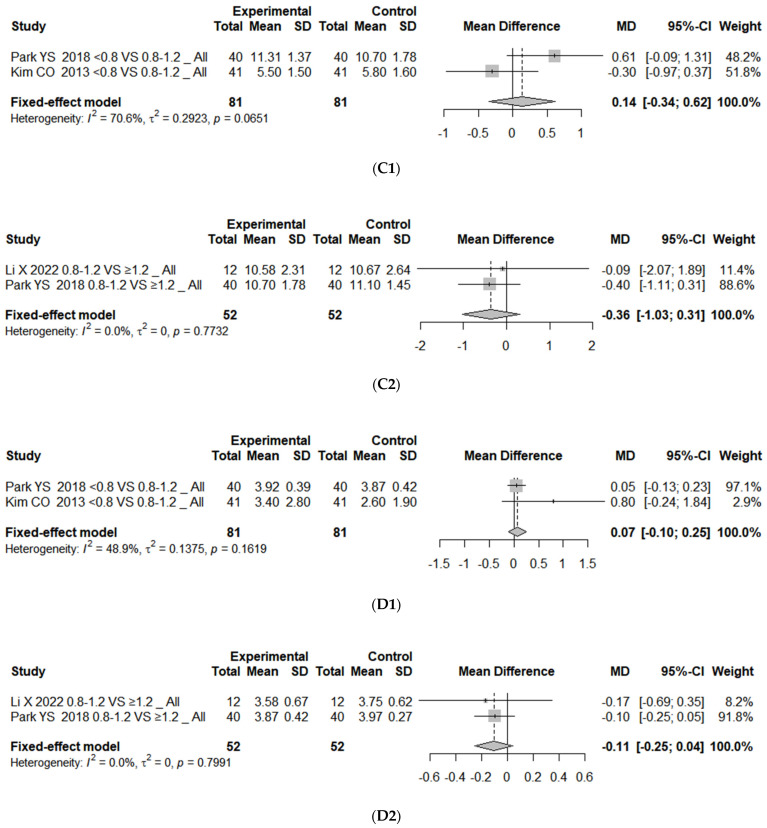
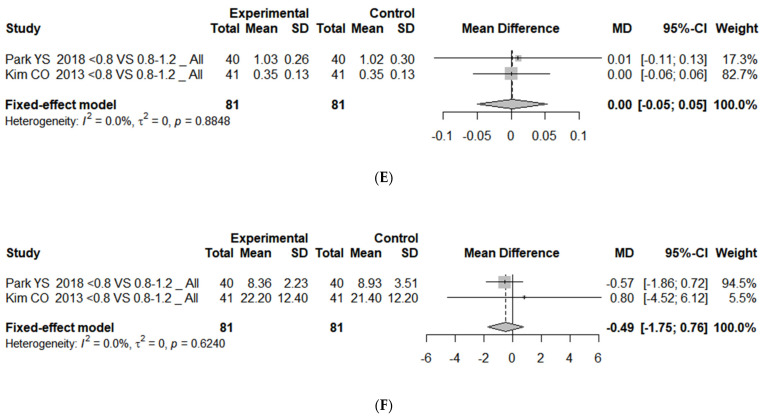
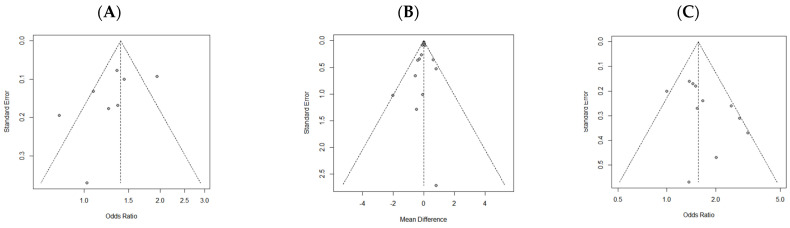
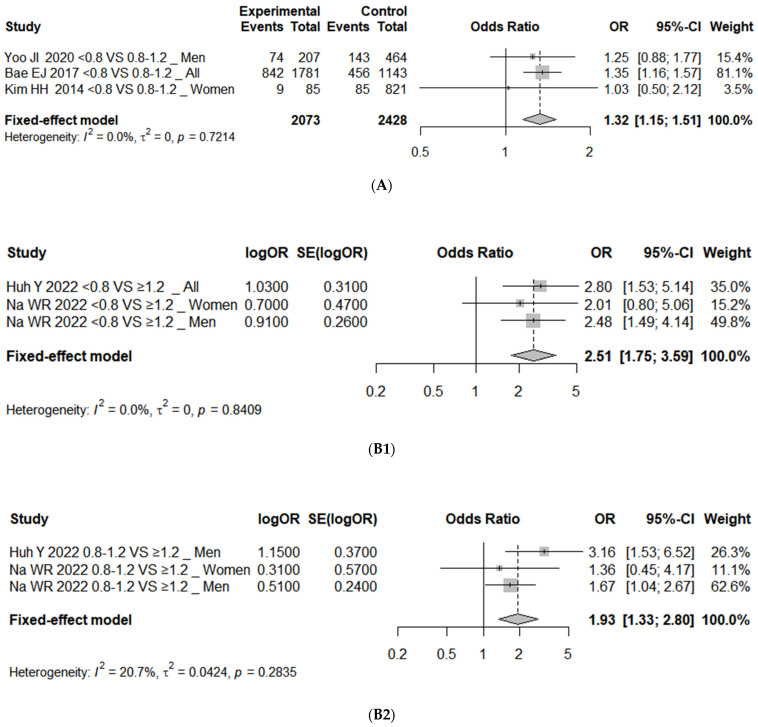
Results: A meta-analysis found that the risk of sarcopenia was significantly higher in the <0.8 g/kg/day protein intake group compared to the 0.8-1.2 g/kg/day and ≥1.2 g/kg/day groups, with odds ratios (ORs) of 1.25 (95% confidence interval (CI), 1.10 to 1.42; I2 = 55%) and 1.79 (95% CI, 1.53 to 2.10; I2 = 71%), respectively. For low hand grip strength (HGS), the risk was higher in the <0.8 g/kg/day group compared to the 0.8-1.2 g/kg/day or ≥1.2 g/kg/day groups (OR 1.31; 95% CI, 1.03 to 1.65; I2 = 28%). No significant associations were found with other sarcopenia indicators, such as skeletal muscle mass, short physical performance battery score, balance test, gait speed, and timed up-and-go test.

Conclusions: Lower protein intake is associated with a higher risk of sarcopenia and low HGS in Korean older adults. To establish protein intake recommendations for the prevention and management of sarcopenia in this population, further well-designed RCTs incorporating both protein supplementation and resistance training are necessary.

Keywords: Korean; aged; meta-analysis; protein; sarcopenia; systematic review.


Conflict of interest statement

The authors declare no potential conflicts of interest.

Figures

Figure 1
Figure 1
PRISMA 2020 flow diagram of article selection.
Figure 2
Figure 2
Forest plot of association between protein intake and (A1) sarcopenia with unadjusted OR (<0.8 vs. 0.8–1.2 as reference) [38,41,44], (A2) sarcopenia with unadjusted OR (<0.8 vs. ≥1.2 as reference) [38,41], (A3) sarcopenia with unadjusted OR (0.8–1.2 vs. ≥1.2 as reference) [38,41], (B1) sarcopenia with adjusted OR (<0.8 vs. ≥1.2 as reference) [38,39,40], and (B2) sarcopenia with adjusted OR (0.8–1.2 vs. ≥1.2 as reference) [38,39,40]. OR represents risk of each outcome in comparison group compared to reference group 0.8, protein intake 0.8 g/kg/day; 0.8–1.2, protein intake 0.8–1.2 g/kg/day; ≥1.2, protein intake ≥ 1.2 g/kg/day. OR, odds ratio; CI, confidence interval; SE, standard error.
Figure 2
Figure 2
Forest plot of association between protein intake and (A1) sarcopenia with unadjusted OR (<0.8 vs. 0.8–1.2 as reference) [38,41,44], (A2) sarcopenia with unadjusted OR (<0.8 vs. ≥1.2 as reference) [38,41], (A3) sarcopenia with unadjusted OR (0.8–1.2 vs. ≥1.2 as reference) [38,41], (B1) sarcopenia with adjusted OR (<0.8 vs. ≥1.2 as reference) [38,39,40], and (B2) sarcopenia with adjusted OR (0.8–1.2 vs. ≥1.2 as reference) [38,39,40]. OR represents risk of each outcome in comparison group compared to reference group 0.8, protein intake 0.8 g/kg/day; 0.8–1.2, protein intake 0.8–1.2 g/kg/day; ≥1.2, protein intake ≥ 1.2 g/kg/day. OR, odds ratio; CI, confidence interval; SE, standard error.
Figure 3
Figure 3
Forest plot of subgroup analysis of association between protein intake and (A) sarcopenia with unadjusted OR (<0.8 vs. 0.8–1.2 as reference) [41,44], and (B) sarcopenia with adjusted OR (0.8–1.2 vs. ≥1.2 as reference) [39,40]. OR represents risk of each outcome in comparison group compared to reference group 0.8, protein intake 0.8 g/kg/day; 0.8–1.2, protein intake 0.8–1.2 g/kg/day; ≥1.2, protein intake ≥ 1.2 g/kg/day. OR, odds ratio; CI, confidence interval; SE, standard error.
Figure 3
Figure 3
Forest plot of subgroup analysis of association between protein intake and (A) sarcopenia with unadjusted OR (<0.8 vs. 0.8–1.2 as reference) [41,44], and (B) sarcopenia with adjusted OR (0.8–1.2 vs. ≥1.2 as reference) [39,40]. OR represents risk of each outcome in comparison group compared to reference group 0.8, protein intake 0.8 g/kg/day; 0.8–1.2, protein intake 0.8–1.2 g/kg/day; ≥1.2, protein intake ≥ 1.2 g/kg/day. OR, odds ratio; CI, confidence interval; SE, standard error.
Figure 4
Figure 4
Forest plot of association between protein intake and (A) skeletal muscle mass (kg) (0.8–1.2 vs. ≥1.2 as reference) [24,47], (B) low HGS (<0.8 vs. 0.8–1.2 or ≥1.2 as reference) [55,56], (C1) SPPB score (<0.8 vs. 0.8–1.2 as reference) [16,23], (C2) SPPB score (0.8–1.2 vs. ≥1.2 as reference), (D1) balance test (seconds) (<0.8 vs. 0.8–1.2 as reference) [16,23], (D2) balance test (seconds) (0.8–1.2 vs. ≥1.2 as reference) [16,24], (E) gait speed (m/s) (<0.8 vs. 0.8–1.2 as reference) [16,23], and (F) TUG test (seconds) (<0.8 vs. 0.8–1.2 as reference) [16,23]. OR represents risk of each outcome in comparison group compared to reference group 0.8, protein intake 0.8 g/kg/day; 0.8–1.2, protein intake 0.8–1.2 g/kg/day; ≥1.2, protein intake ≥ 1.2 g/kg/day. HGS; hand grip strength; SPPB, short physical performance battery; TUG, timed up-and-go; SD, standard deviation; MD, mean difference; OR, odds ratio; SE, standard error; CI, confidence interval.
Figure 4
Figure 4
Forest plot of association between protein intake and (A) skeletal muscle mass (kg) (0.8–1.2 vs. ≥1.2 as reference) [24,47], (B) low HGS (<0.8 vs. 0.8–1.2 or ≥1.2 as reference) [55,56], (C1) SPPB score (<0.8 vs. 0.8–1.2 as reference) [16,23], (C2) SPPB score (0.8–1.2 vs. ≥1.2 as reference), (D1) balance test (seconds) (<0.8 vs. 0.8–1.2 as reference) [16,23], (D2) balance test (seconds) (0.8–1.2 vs. ≥1.2 as reference) [16,24], (E) gait speed (m/s) (<0.8 vs. 0.8–1.2 as reference) [16,23], and (F) TUG test (seconds) (<0.8 vs. 0.8–1.2 as reference) [16,23]. OR represents risk of each outcome in comparison group compared to reference group 0.8, protein intake 0.8 g/kg/day; 0.8–1.2, protein intake 0.8–1.2 g/kg/day; ≥1.2, protein intake ≥ 1.2 g/kg/day. HGS; hand grip strength; SPPB, short physical performance battery; TUG, timed up-and-go; SD, standard deviation; MD, mean difference; OR, odds ratio; SE, standard error; CI, confidence interval.
Figure 5
Figure 5
Funnel plot of included studies of (A) unadjusted data (sarcopenia), (B) continuous data (skeletal muscle mass, SPPB score, balance test, gait speed, and TUG test), and (C) adjusted data (sarcopenia, low HGS). SPPB, short physical performance battery test; TUG, timed up-and-go; HGS; hand grip strength.
Figure 6
Figure 6
Forest plot of sensitivity analysis of association between protein intake and (A) sarcopenia with unadjusted OR (<0.8 vs. 0.8–1.2 as reference) [38,41,44], (B1) sarcopenia with adjusted OR (<0.8 vs. ≥1.2 as reference) [39,40], and (B2) sarcopenia with adjusted OR (0.8–1.2 vs. ≥1.2 as reference) [39,40]. OR represents risk of each outcome in comparison group compared to reference group 0.8, protein intake 0.8 g/kg/day; 0.8–1.2, protein intake 0.8–1.2 g/kg/day; ≥1.2, protein intake ≥ 1.2 g/kg/day. OR, odds ratio; CI, confidence interval; SE, standard error.

Similar articles

Cited by

References

    1. Salive M.E. Multimorbidity in Older Adults. Epidemiol. Rev. 2013;35:75–83. doi: 10.1093/epirev/mxs009. - DOI - PubMed
    1. von Haehling S., Morley J.E., Anker S.D. From muscle wasting to sarcopenia and myopenia: Update 2012. J. Cachexia Sarcopenia Muscle. 2012;3:213–217. doi: 10.1007/s13539-012-0089-z. - DOI - PMC - PubMed
    1. Fielding R.A., Vellas B., Evans W.J., Bhasin S., Morley J.E., Newman A.B., Abellan van Kan G., Andrieu S., Bauer J., Breuille D., et al. Sarcopenia: An undiagnosed condition in older adults. Current consensus definition: Prevalence, etiology, and consequences. International working group on sarcopenia. J. Am. Med. Dir. Assoc. 2011;12:249–256. doi: 10.1016/j.jamda.2011.01.003. - DOI - PMC - PubMed
    1. Welle S., Brooks A.I., Delehanty J.M., Needler N., Thornton C.A. Gene expression profile of aging in human muscle. Physiol. Genom. 2003;14:149–159. doi: 10.1152/physiolgenomics.00049.2003. - DOI - PubMed
    1. Baumgartner R.N., Waters D.L., Gallagher D., Morley J.E., Garry P.J. Predictors of skeletal muscle mass in elderly men and women. Mech. Ageing Dev. 1999;107:123–136. doi: 10.1016/S0047-6374(98)00130-4. - DOI - PubMed

Substances

LinkOut - more resources