. 2024 Nov 22;12(12):839.
doi: 10.3390/toxics12120839.

Using Sediment Bacterial Communities to Predict Trace Metal Pollution Risk in Coastal Environment Management: Feasibility, Reliability, and Practicability

Affiliations

Using Sediment Bacterial Communities to Predict Trace Metal Pollution Risk in Coastal Environment Management: Feasibility, Reliability, and Practicability

Yuanfen Xia et al. Toxics. .

Abstract

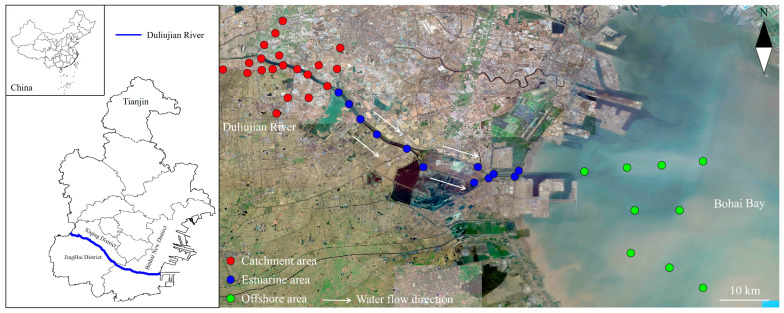
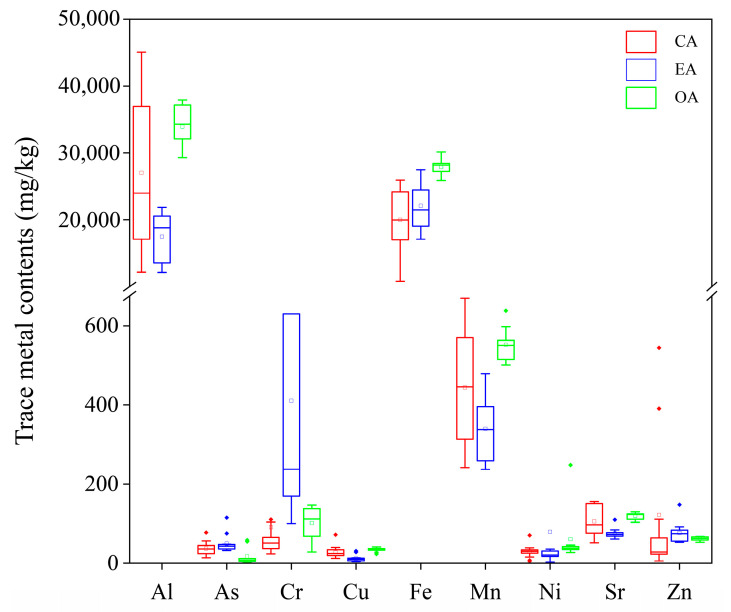
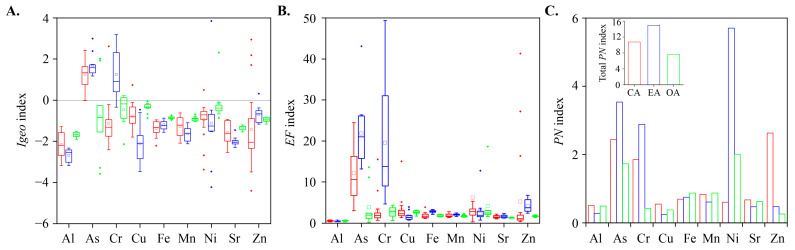
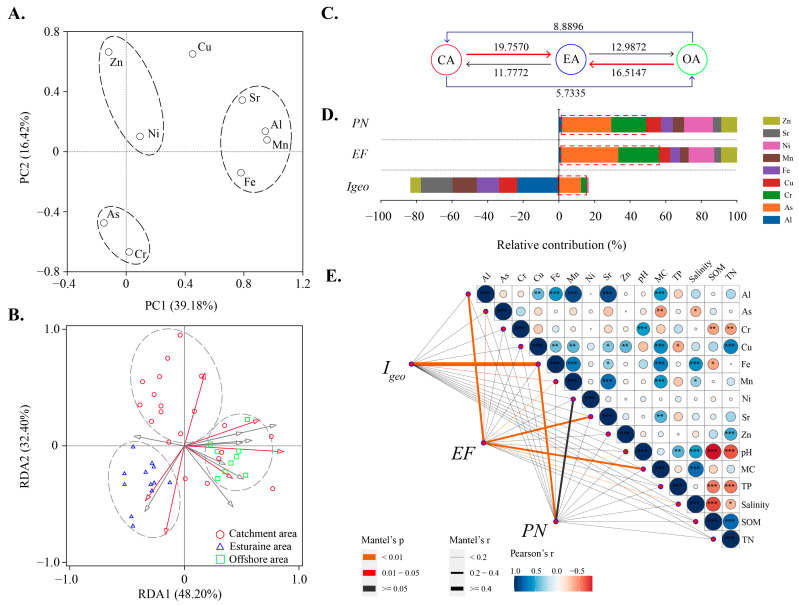
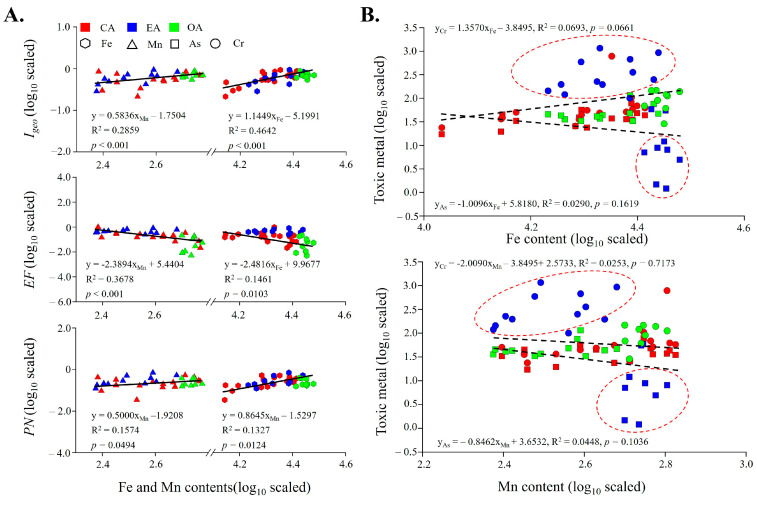
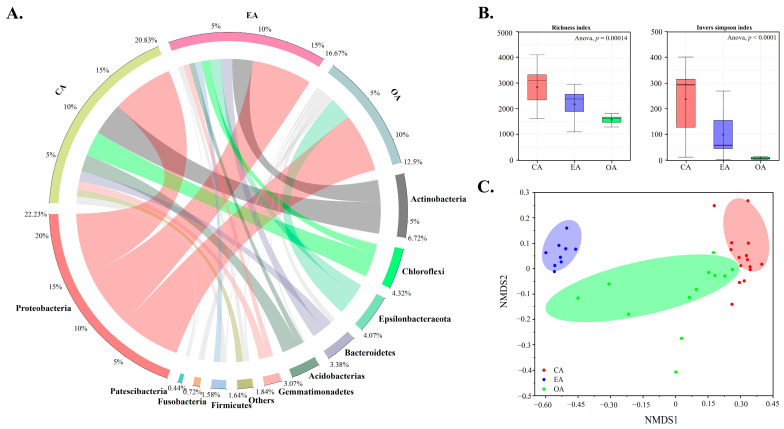
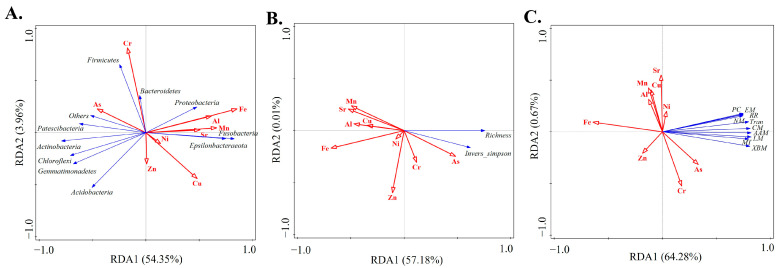
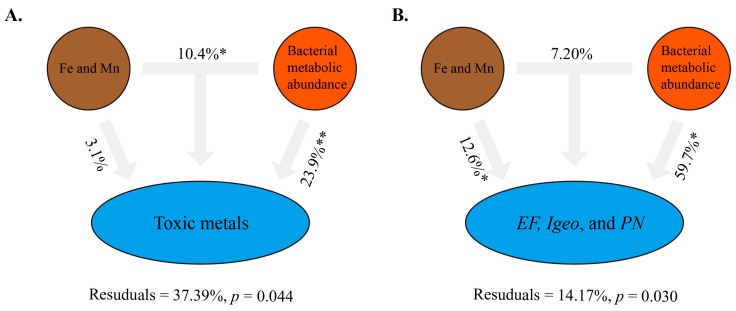
The distribution of trace metals (TMs) in a continuous water body often exhibits watershed attributes, but the tidal gates of the coastal rivers may alter their transformation and accumulation patterns. Therefore, a tidal gate-controlled coastal river was selected to test the distribution and accumulation risks of Al, As, Cr, Cu, Fe, Mn, Ni, Sr, and Zn in the catchment area (CA), estuarine area (EA), and offshore area (OA). Associations between TMs and bacterial communities were analyzed to assess the feasibility of using bacterial parameters as ecological indicators. The results showed that As and Cr were the key pollutants due to the higher enrichment factor and geoaccumulation index, reaching slight to moderate pollution levels. The Nemero index was highest in EAs (14.93), indicating a higher pollution risk in sediments near tide gates. Although the TM dynamics can be explained by the metal-indicating effects of Fe and Mn, they have no linear relationships with toxic metals. Interestingly, the metabolic abundance of bacterial communities showed good correlations with different TMs in the sediment. These results highlight bacterial community characteristics as effective biomarkers for assessing TM pollution and practical tools for managing pollution control in coastal environment.

Keywords: accumulation risk; bacterial community; coastal watershed; tidal gate; trace metals.


Conflict of interest statement

The authors declare no conflicts of interest.

Figures

Figure 1
Figure 1
Sampling locations map in the catchment area (CA), estuarine area (EA), and offshore area (OA) of Duliujian river watershed in Bohai Bay (details in Table S1).
Figure 2
Figure 2
TM contents in the sediments of the CA, EA, and OA of Duliujian river watershed in Bohai Bay.
Figure 3
Figure 3
(A) Geoaccumulation index (Igeo), (B) enrichment factors (EF), and (C) Nemerow pollution index of TMs in the sediments of the CA, EA, and OA of the Duliujian river watershed in Bohai Bay.
Figure 4
Figure 4
(A). Principal component analysis of TMs in the different spatial units. (B) RDA of TM with environmental factors. (C) SourceTracker analysis of the sink and source relationships of TMs in different spatial units. The values represent the total exchange potential. (D) The degree of contribution of TMs in sediments to each index. The red box represents the degree of contributions of As and Cr. (E) Paired comparison of environmental factors and TMs with the TM related indices. The color gradient and circle size represent the Spearman correlation coefficients; the width of the line represents the degree of correlations among potential risks, TMs, and environmental factors. Asterisks denote statistically significant differences (***, p < 0.001; **, p < 0.01; *, p < 0.05).
Figure 5
Figure 5
(A) Regression analysis for pairwise combination of Fe and Mn with TM correlation indices, and (B) pairwise combination of Fe and Mn with toxic metals (As and Cr). Axes are log10 scaled.
Figure 6
Figure 6
Changes in community composition (A) and diversity (B) of bacterial communities and NMDS analysis (C) for determining differences in bacterial communities at the watershed scale.
Figure 7
Figure 7
RDA of TM with bacterial dynamics. (A) TM with dominant abundance of bacterial community; (B) TM with bacterial diversity; (C) TM with bacterial metabolism abundance. Among them, PC represents the poorly characterized; EM represents the energy metabolism; RR represents the replication and repair; NM represents the nucleotide metabolism; Tran represents the translation; CM represents the carbohydrate metabolism; AAM represents the amino acid metabolism; LM represents the lipid metabolism; MT represents the membrane transport; XBM represents the xenobiotics biodegradation and metabolism.
Figure 8
Figure 8
VPA of traditional TM identification (Fe and Mn) and bacterial metabolic abundance for toxic metals (A) and TM-related indices (B). Among them, * and ** represent p < 0.05 and p < 0.01, respectively. Toxic metals contain As and Cr.

Similar articles

References

    1. Goyette J.O., Bennett E.M., Maranger R. Low buffering capacity and slow recovery of anthropogenic phosphorus pollution in watersheds. Nat. Geosci. 2018;11:921–925. doi: 10.1038/s41561-018-0238-x. - DOI
    1. Goyette J.O., Bennett E.M., Maranger R. Differential influence of landscape features and climate on nitrogen and phosphorus transport throughout the watershed. Biogeochemistry. 2019;142:155–174. doi: 10.1007/s10533-018-0526-y. - DOI
    1. Raj P.R.S., Viswanathan P.M. Occurrence and distribution of geochemical elements in Miri estuary, NW Borneo: Evaluating for processes, sources and pollution status. Chemosphere. 2023;316:137838. doi: 10.1016/j.chemosphere.2023.137838. - DOI - PubMed
    1. Uzairu A., Harrison G.F.S., Balarabe M.L., Nnaji J.C. Concentration levels of trace metals in fish and sediment from Kubanni River, Northern Nigeria. Bull. Chem. Soc. Ethiopia. 2009;23:9–17. doi: 10.4314/bcse.v23i1.21293. - DOI
    1. Ardila P.A.R., Alonso R.Á.A., Valsero J.J.D., García R.M., Cabera F.Á., Cosío E.L., Laforet S.D. Assessment of heavy metal pollution in marine sediments from southwest of Mallorca island, Spain. Environ. Sci. Pollut. Res. 2023;30:16852–16866. doi: 10.1007/s11356-022-25014-0. - DOI - PMC - PubMed

LinkOut - more resources